This report is used to compare the budgeted vs actual hours (e.g. how many hours were allocated for support, and how many hours of support were actually provided)
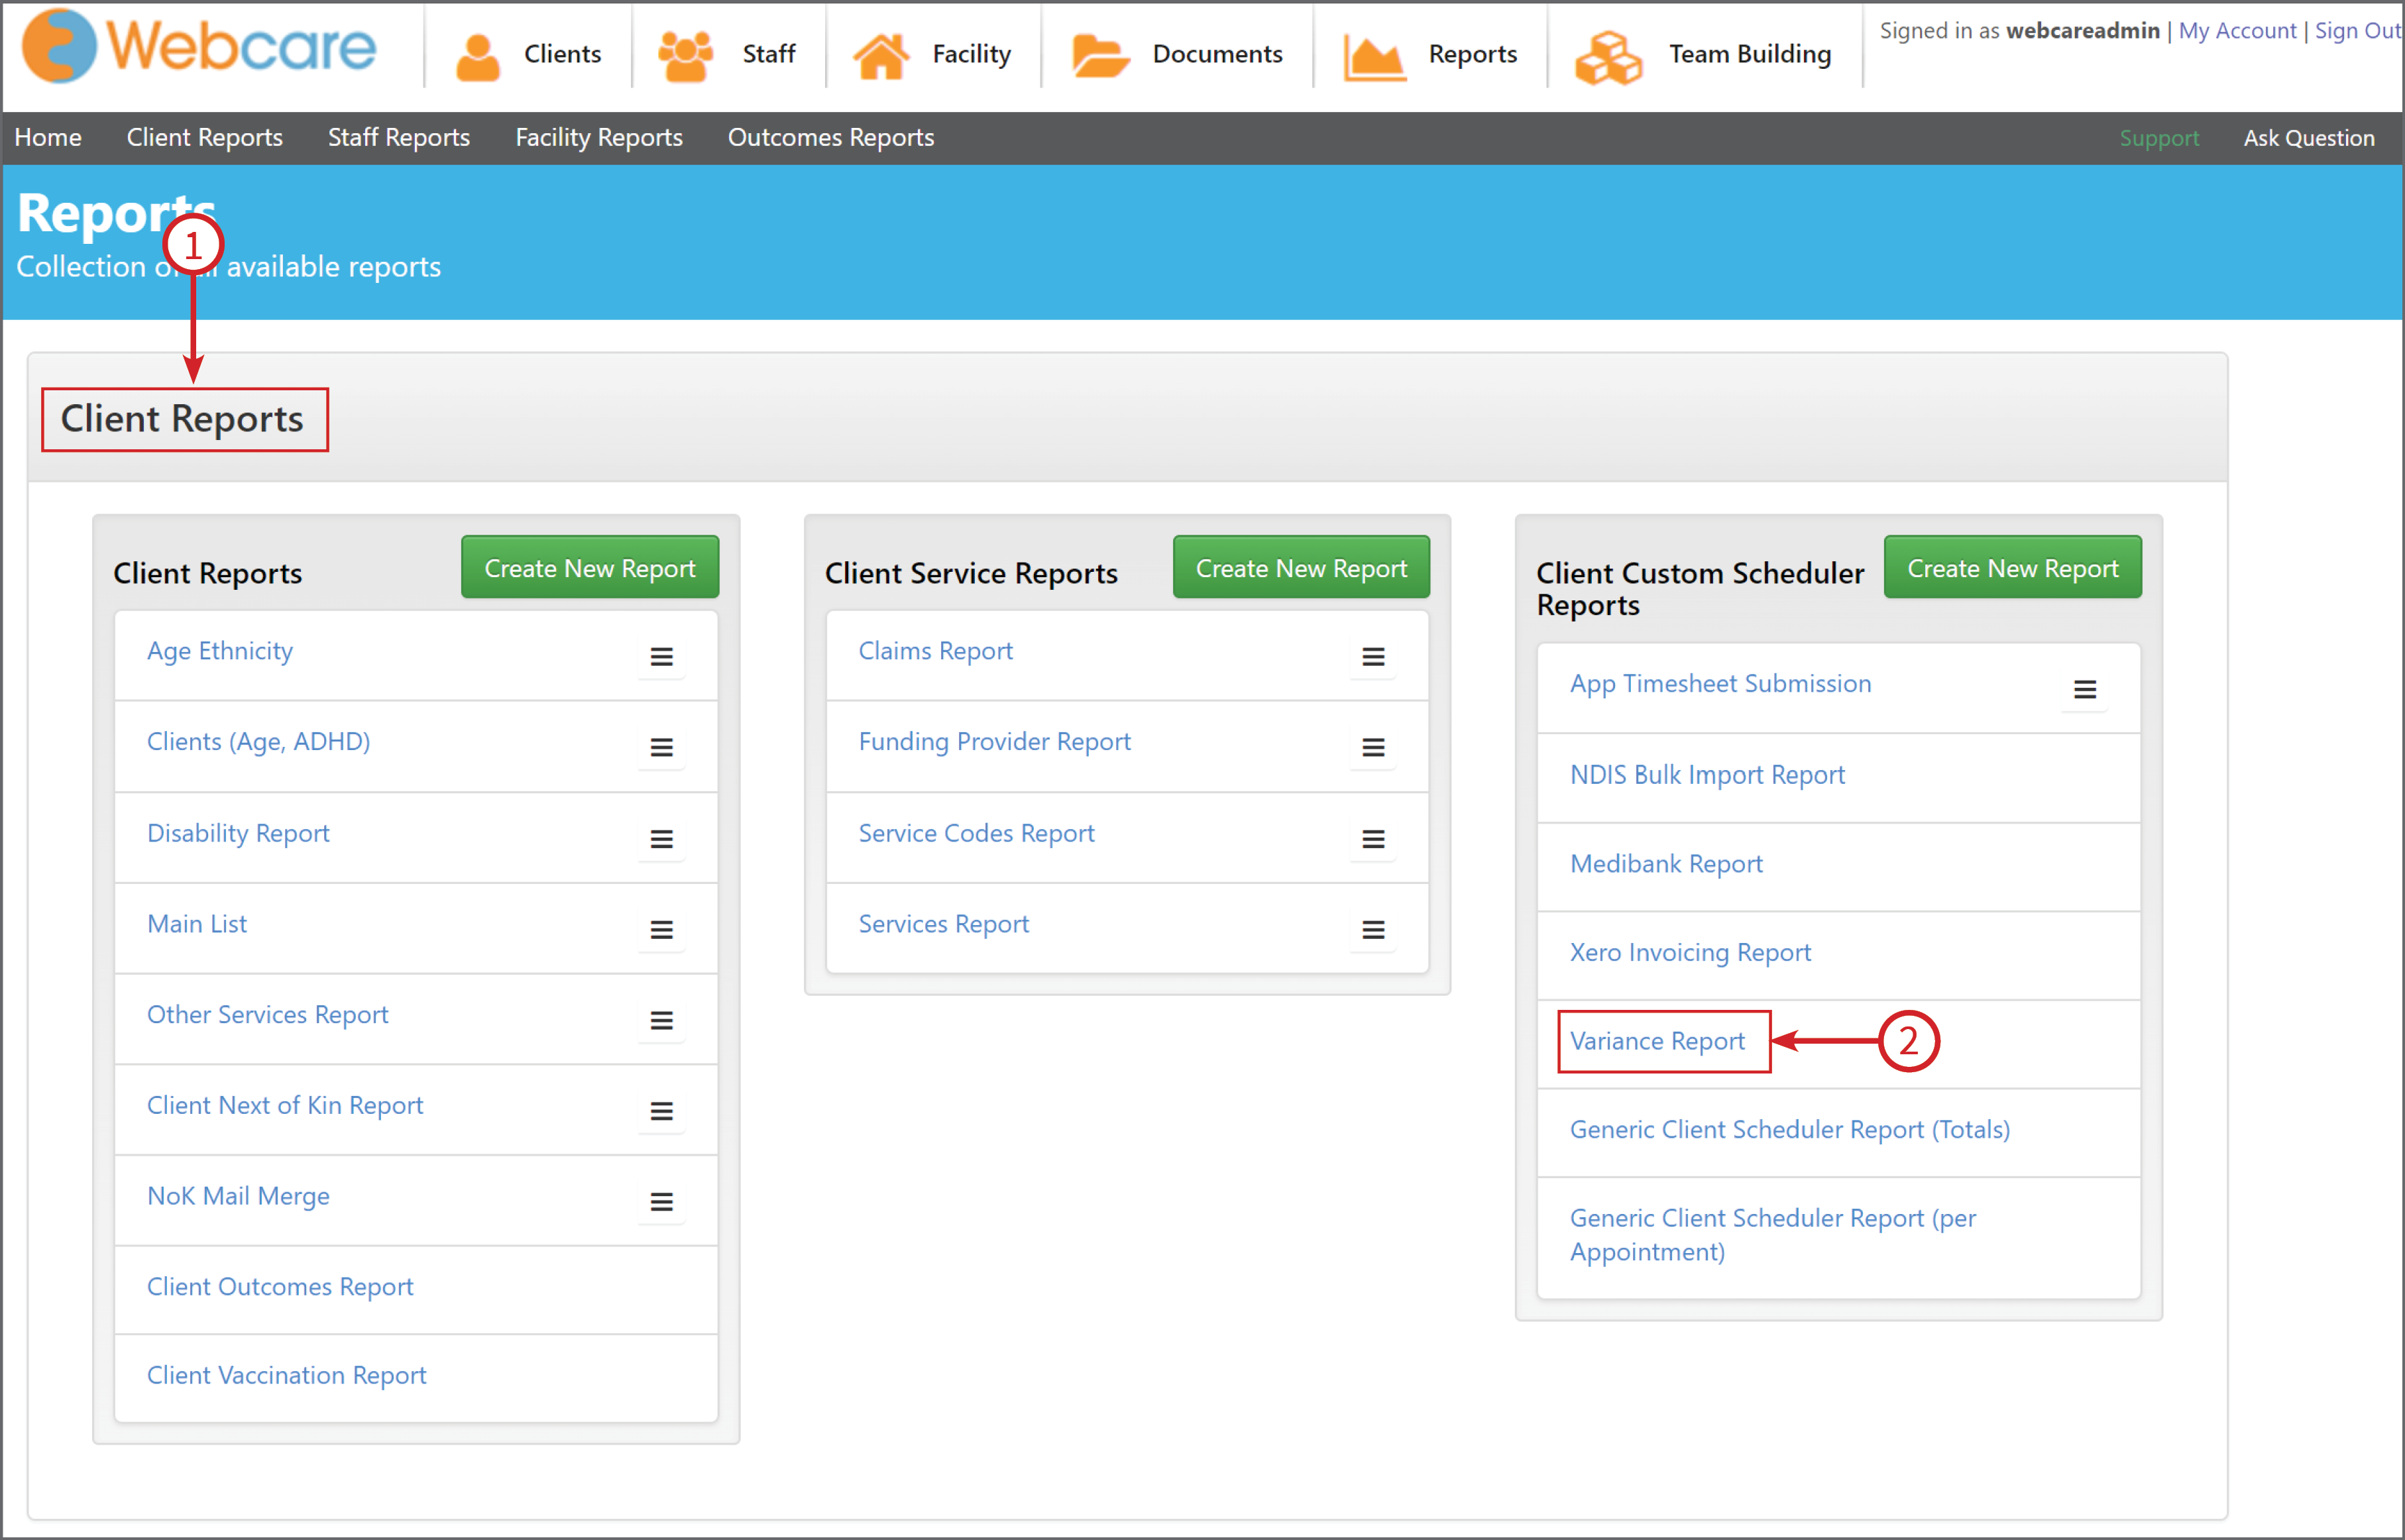
Click Reports on the main menu bar.

Under Client Reports (1), find the report titled Variance Report (2)
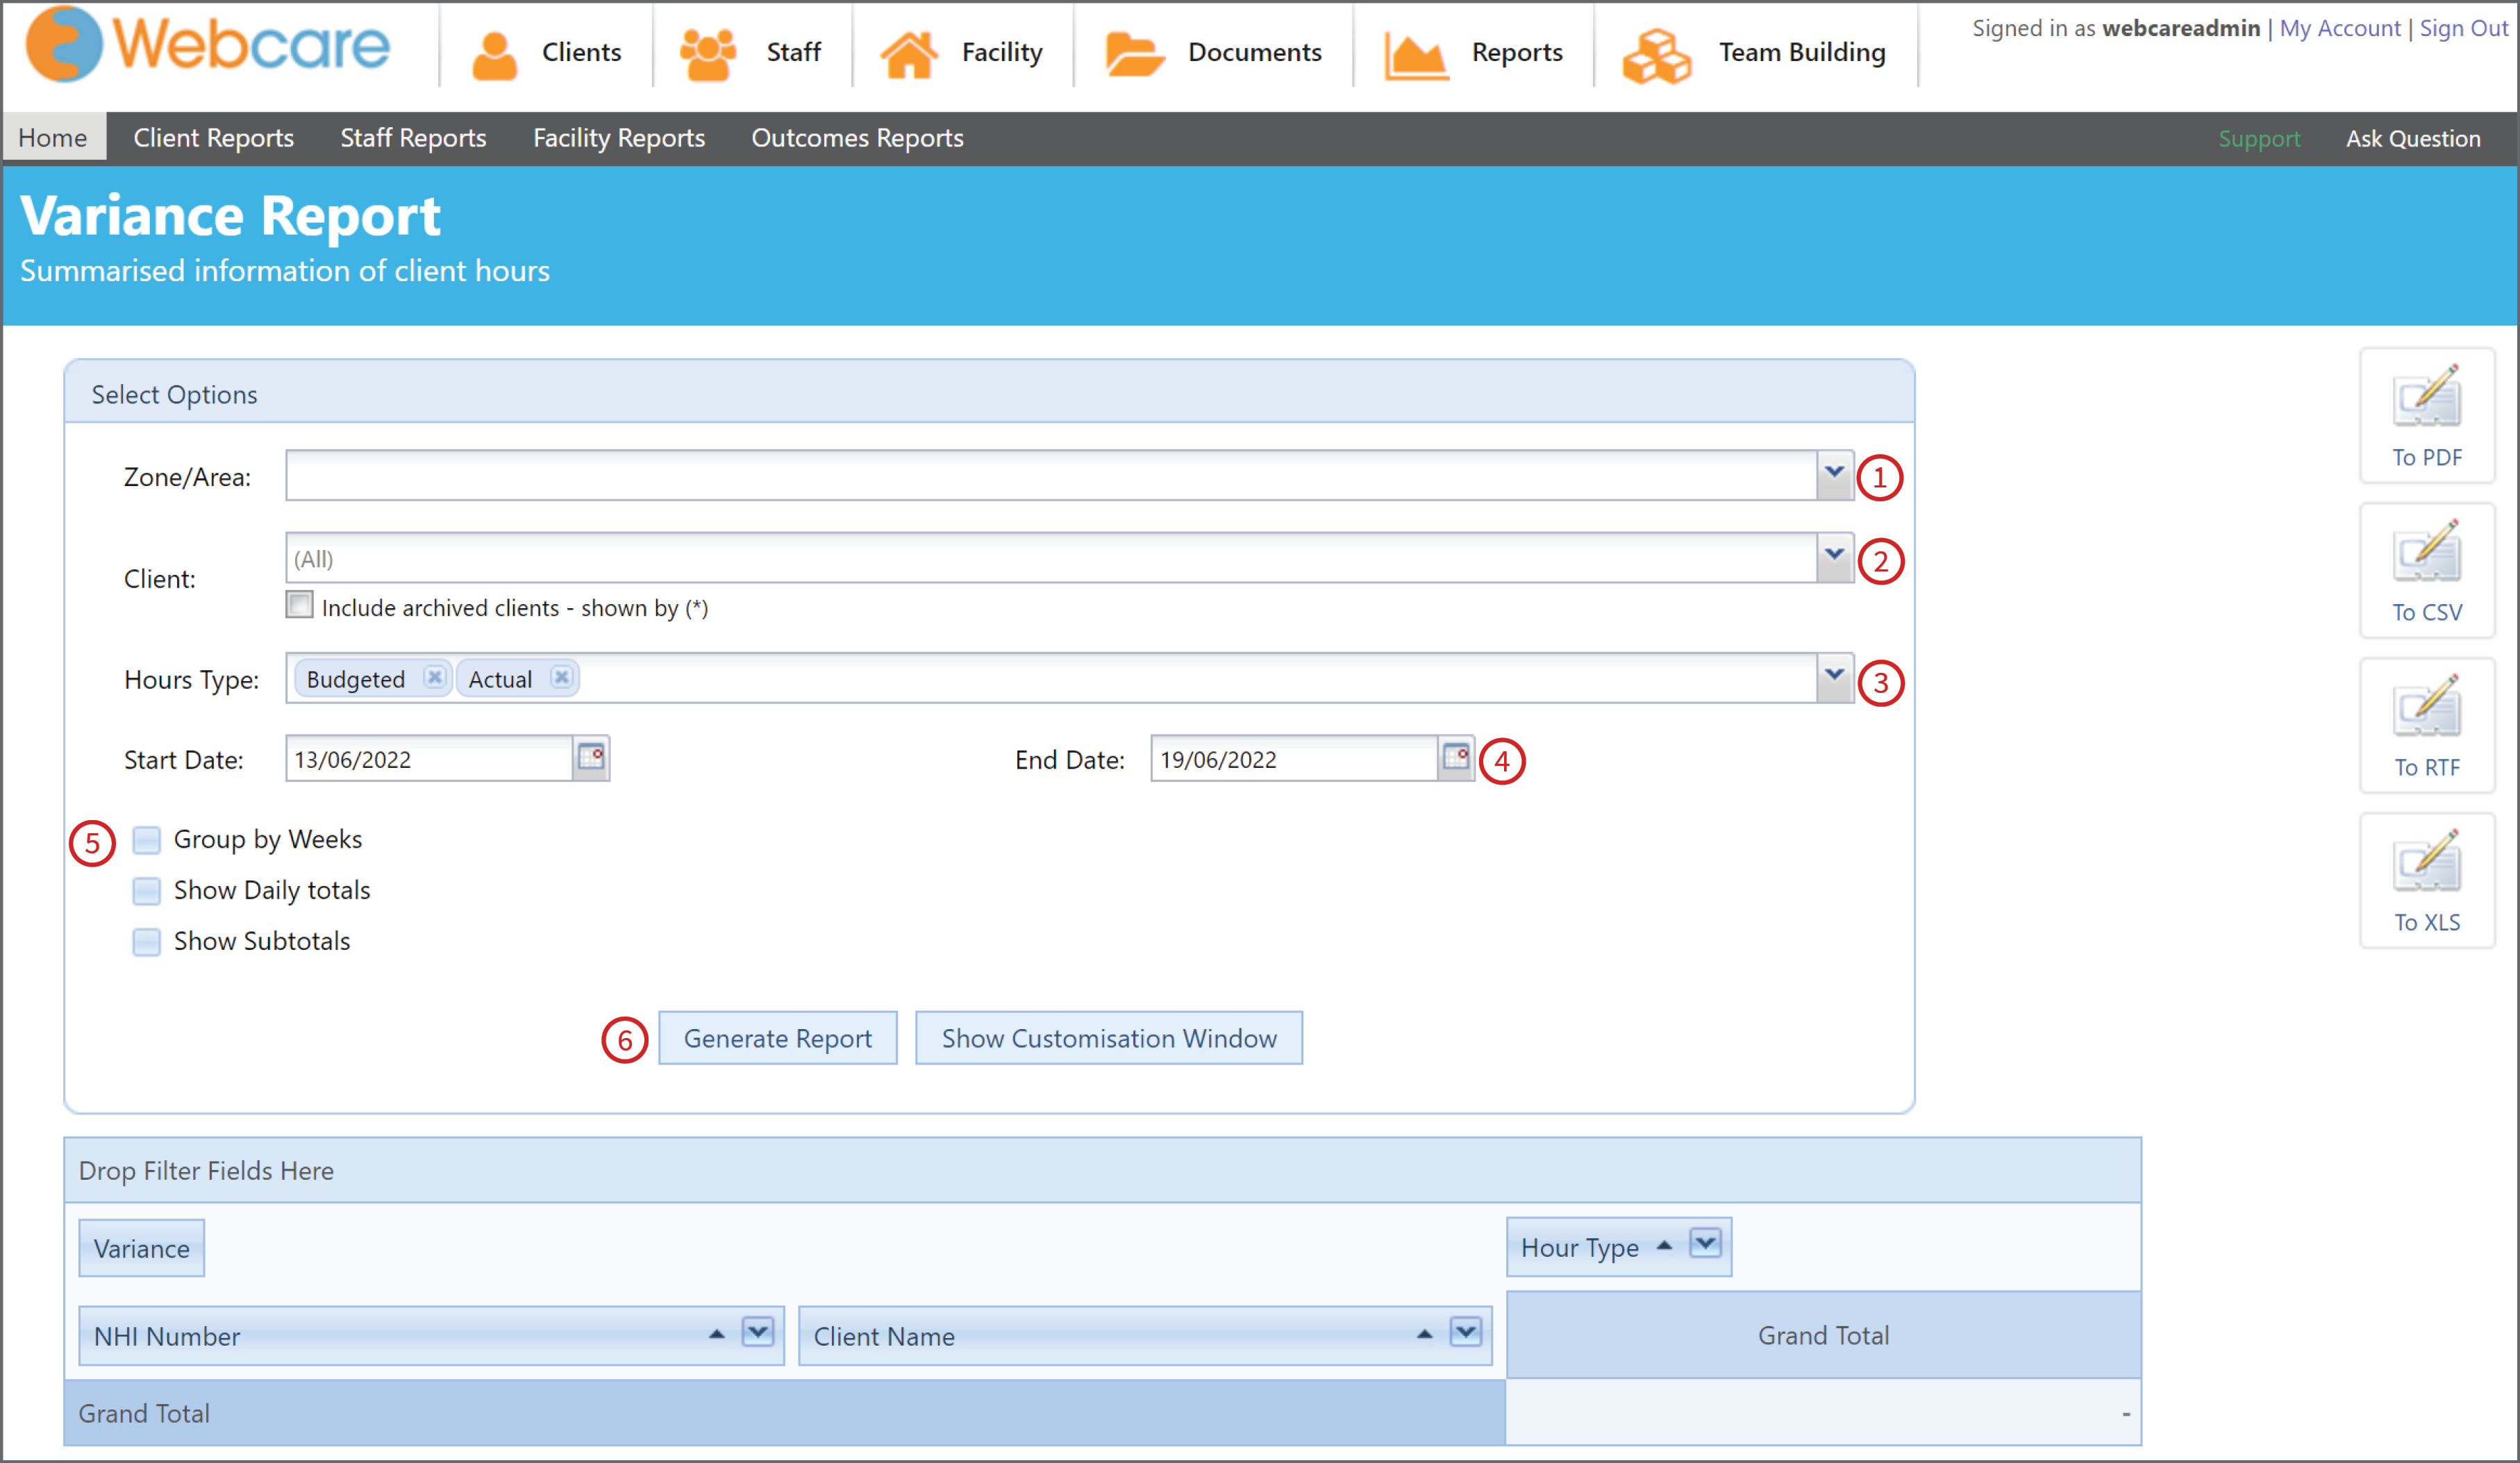
This will open up the options panel for the Variance Report.
- Zone/Area - Select from the drop down menu the zone/area you would like to include in the report, you can leave it blank to include all zones.
- Client - Select one or multiple clients from the drop down menu, you can leave it blank to include all clients.
- Hours Type - For this report, admin should select both Hours Type (i.e. Actual & Budgeted) to compare the hours.
- Dates - Select the date range for the report.
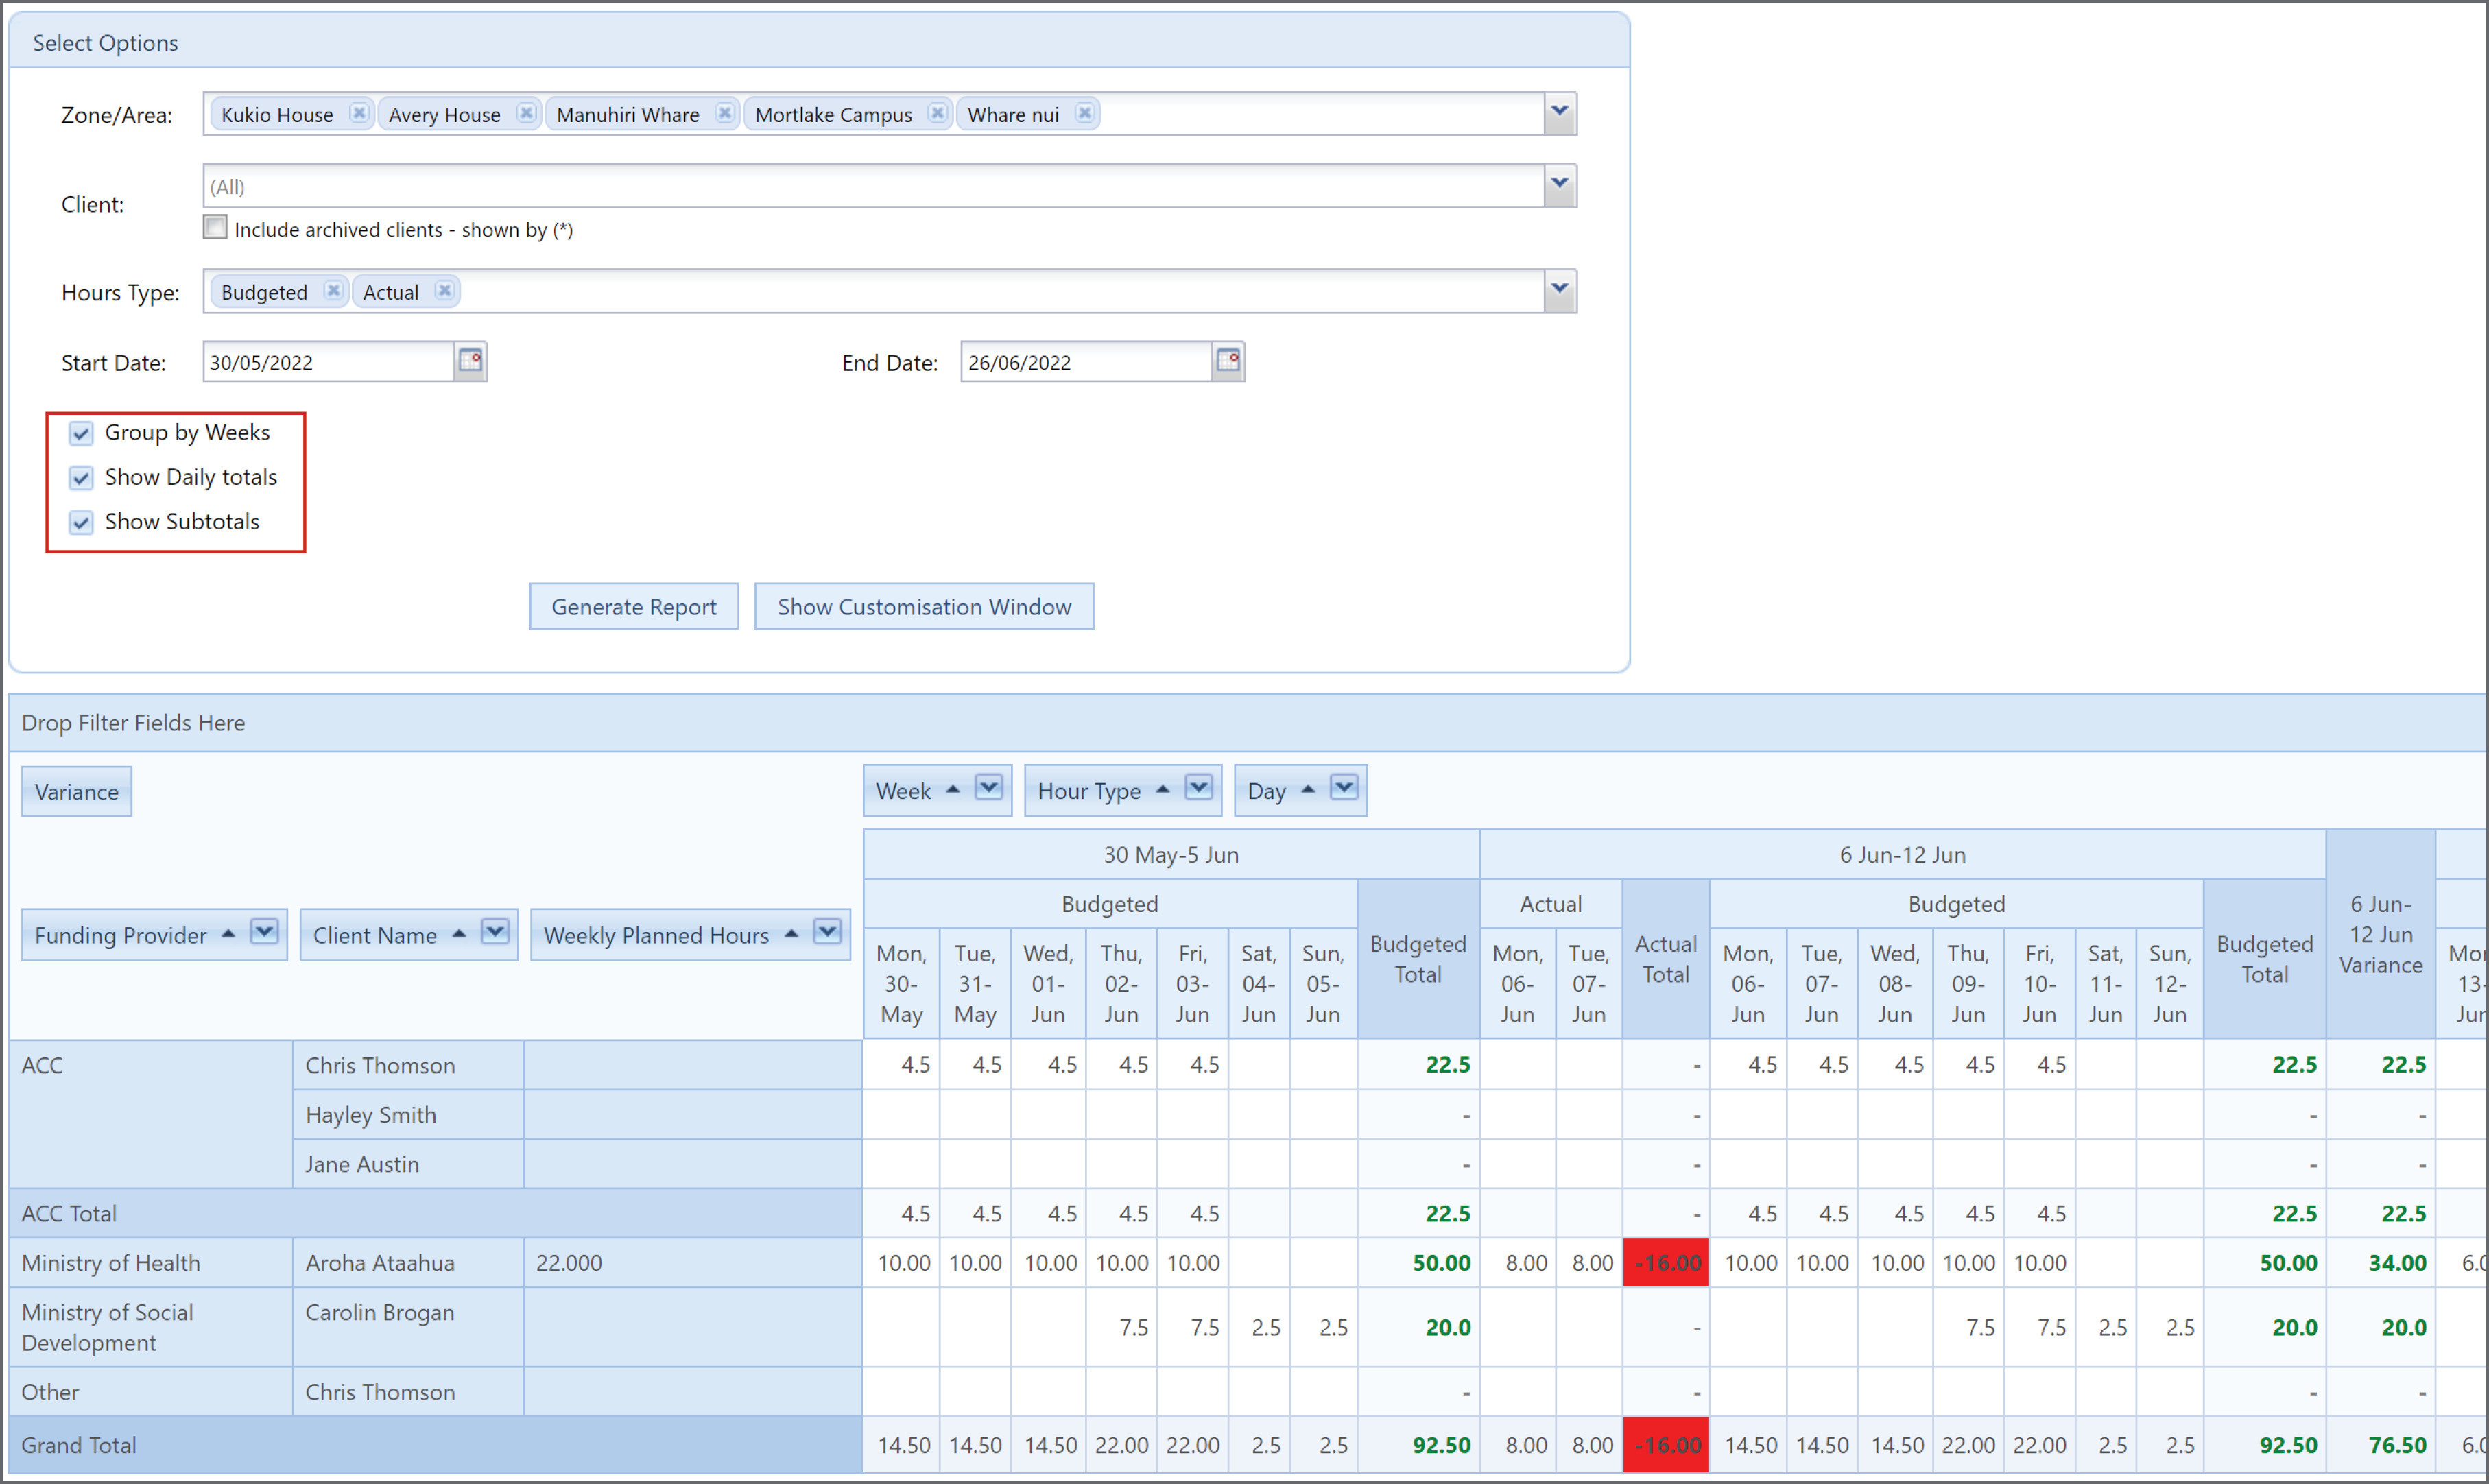
- This report also gives you three additional options:
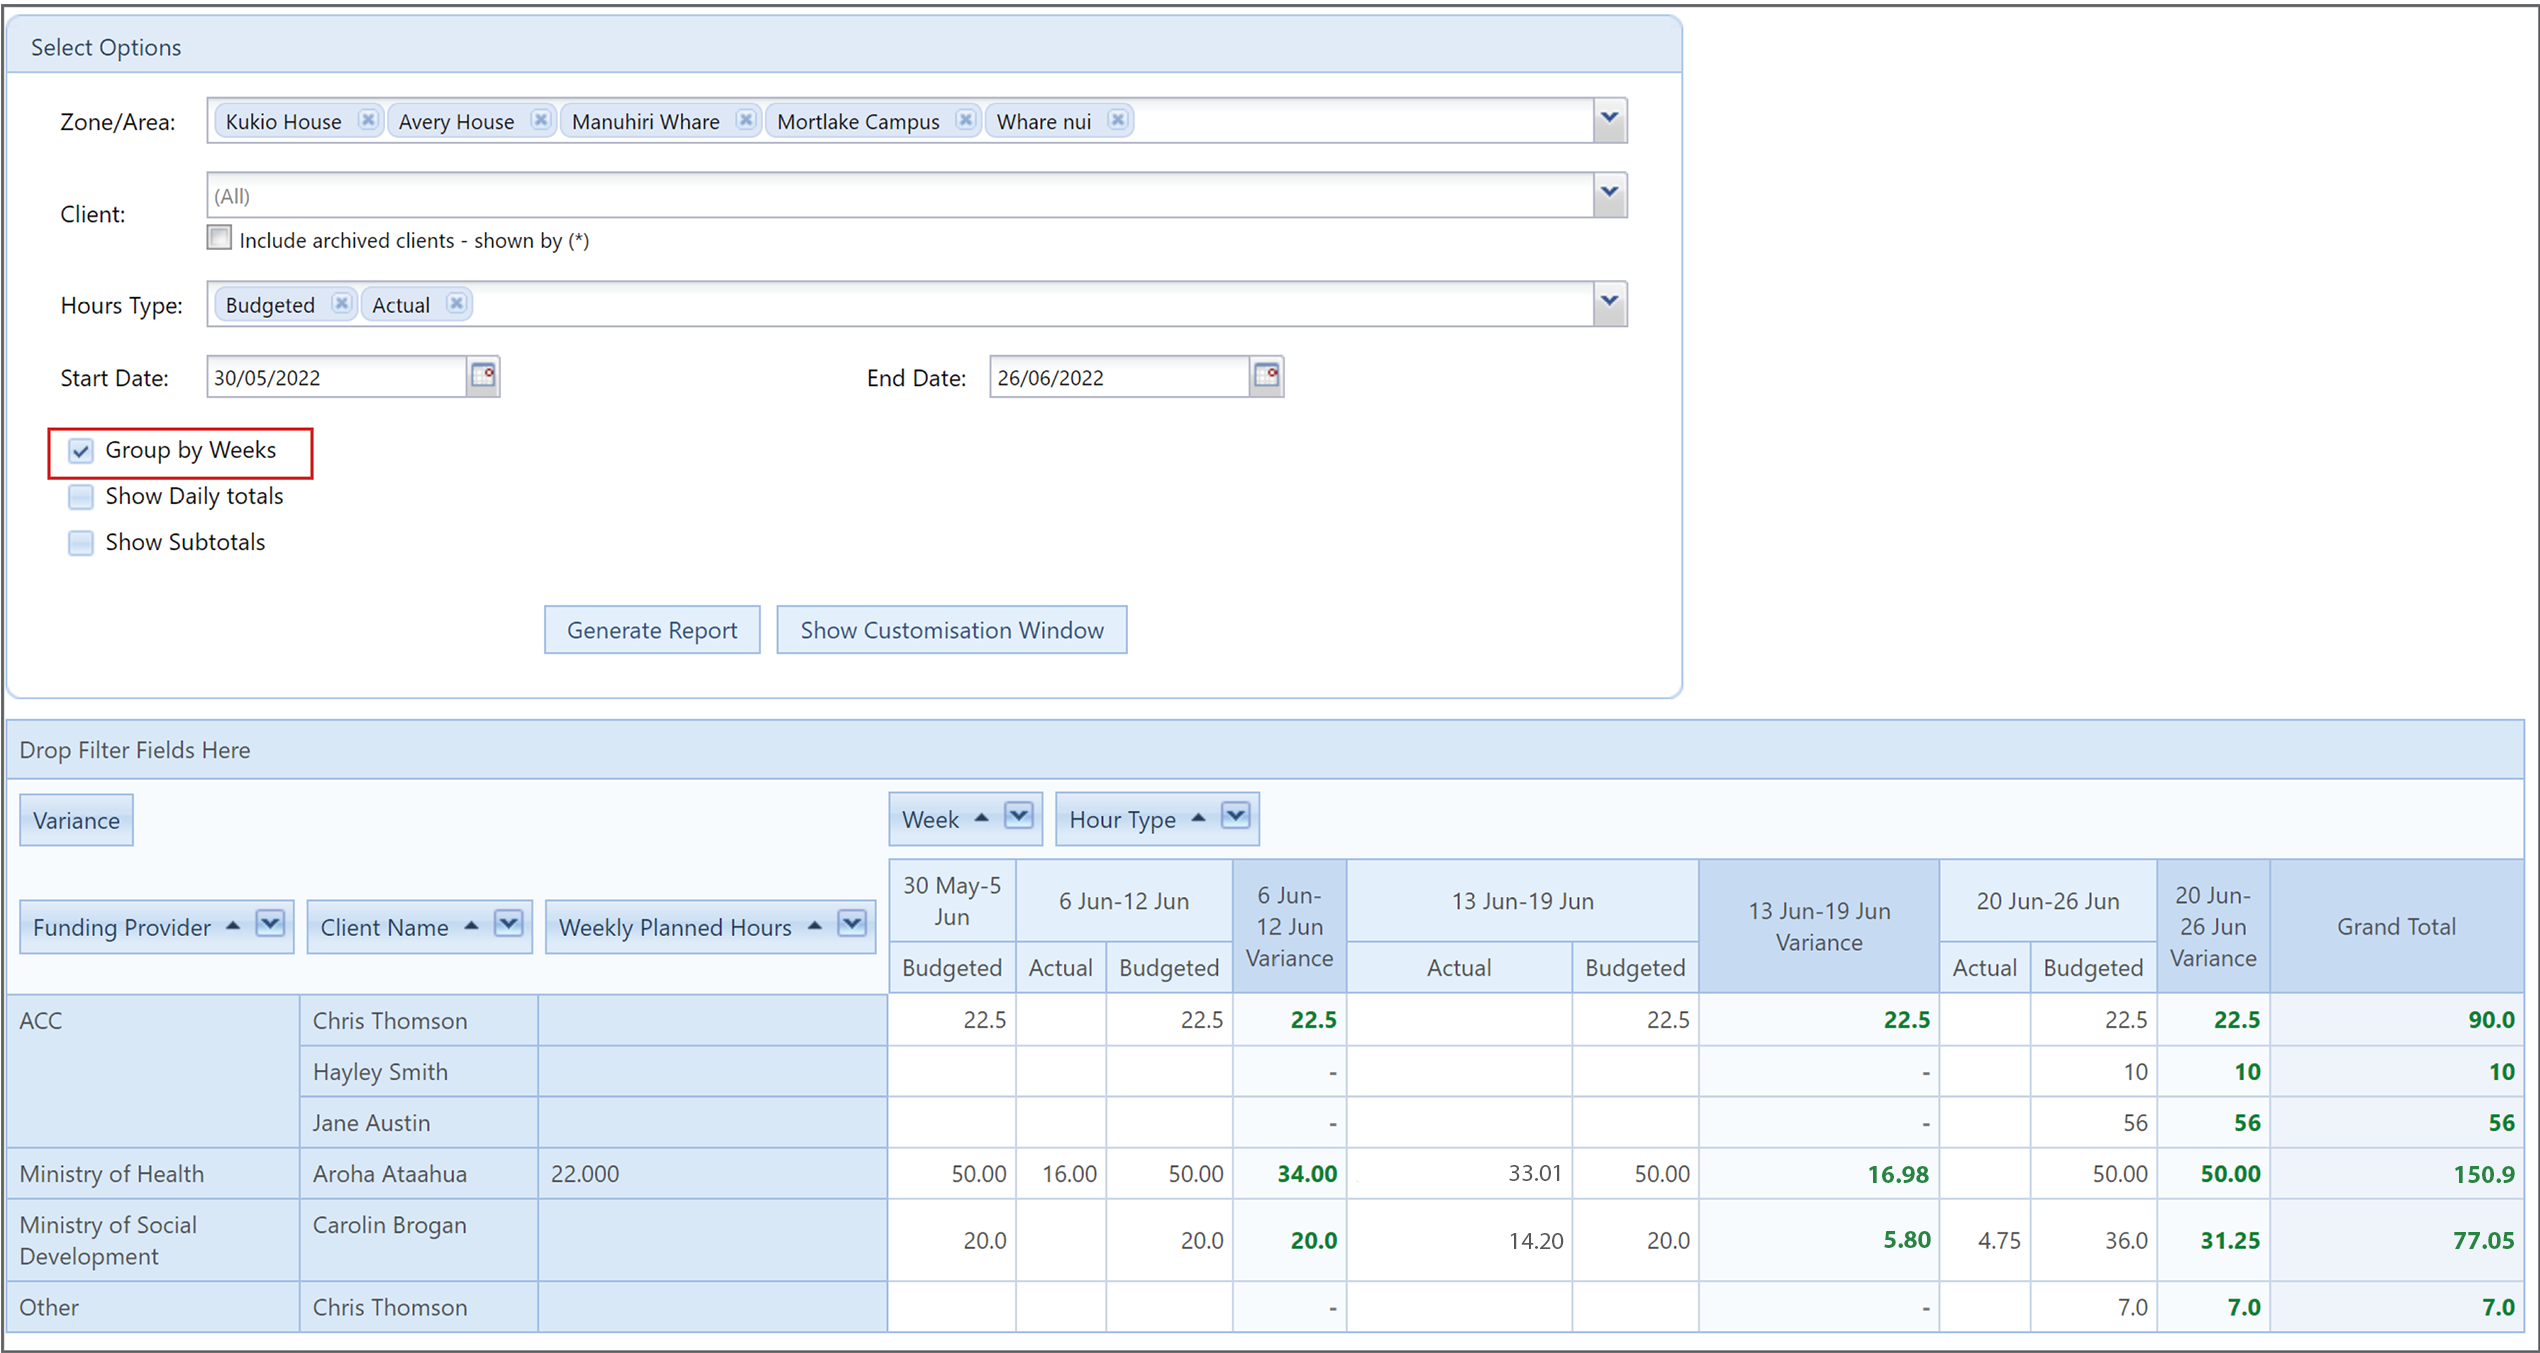
Group by Weeks: The hours are grouped by each week. This helps you compare with ‘Weekly Planner Hours’. This is useful if the report is generated for a fortnight and you want to see a weekly breakdown.
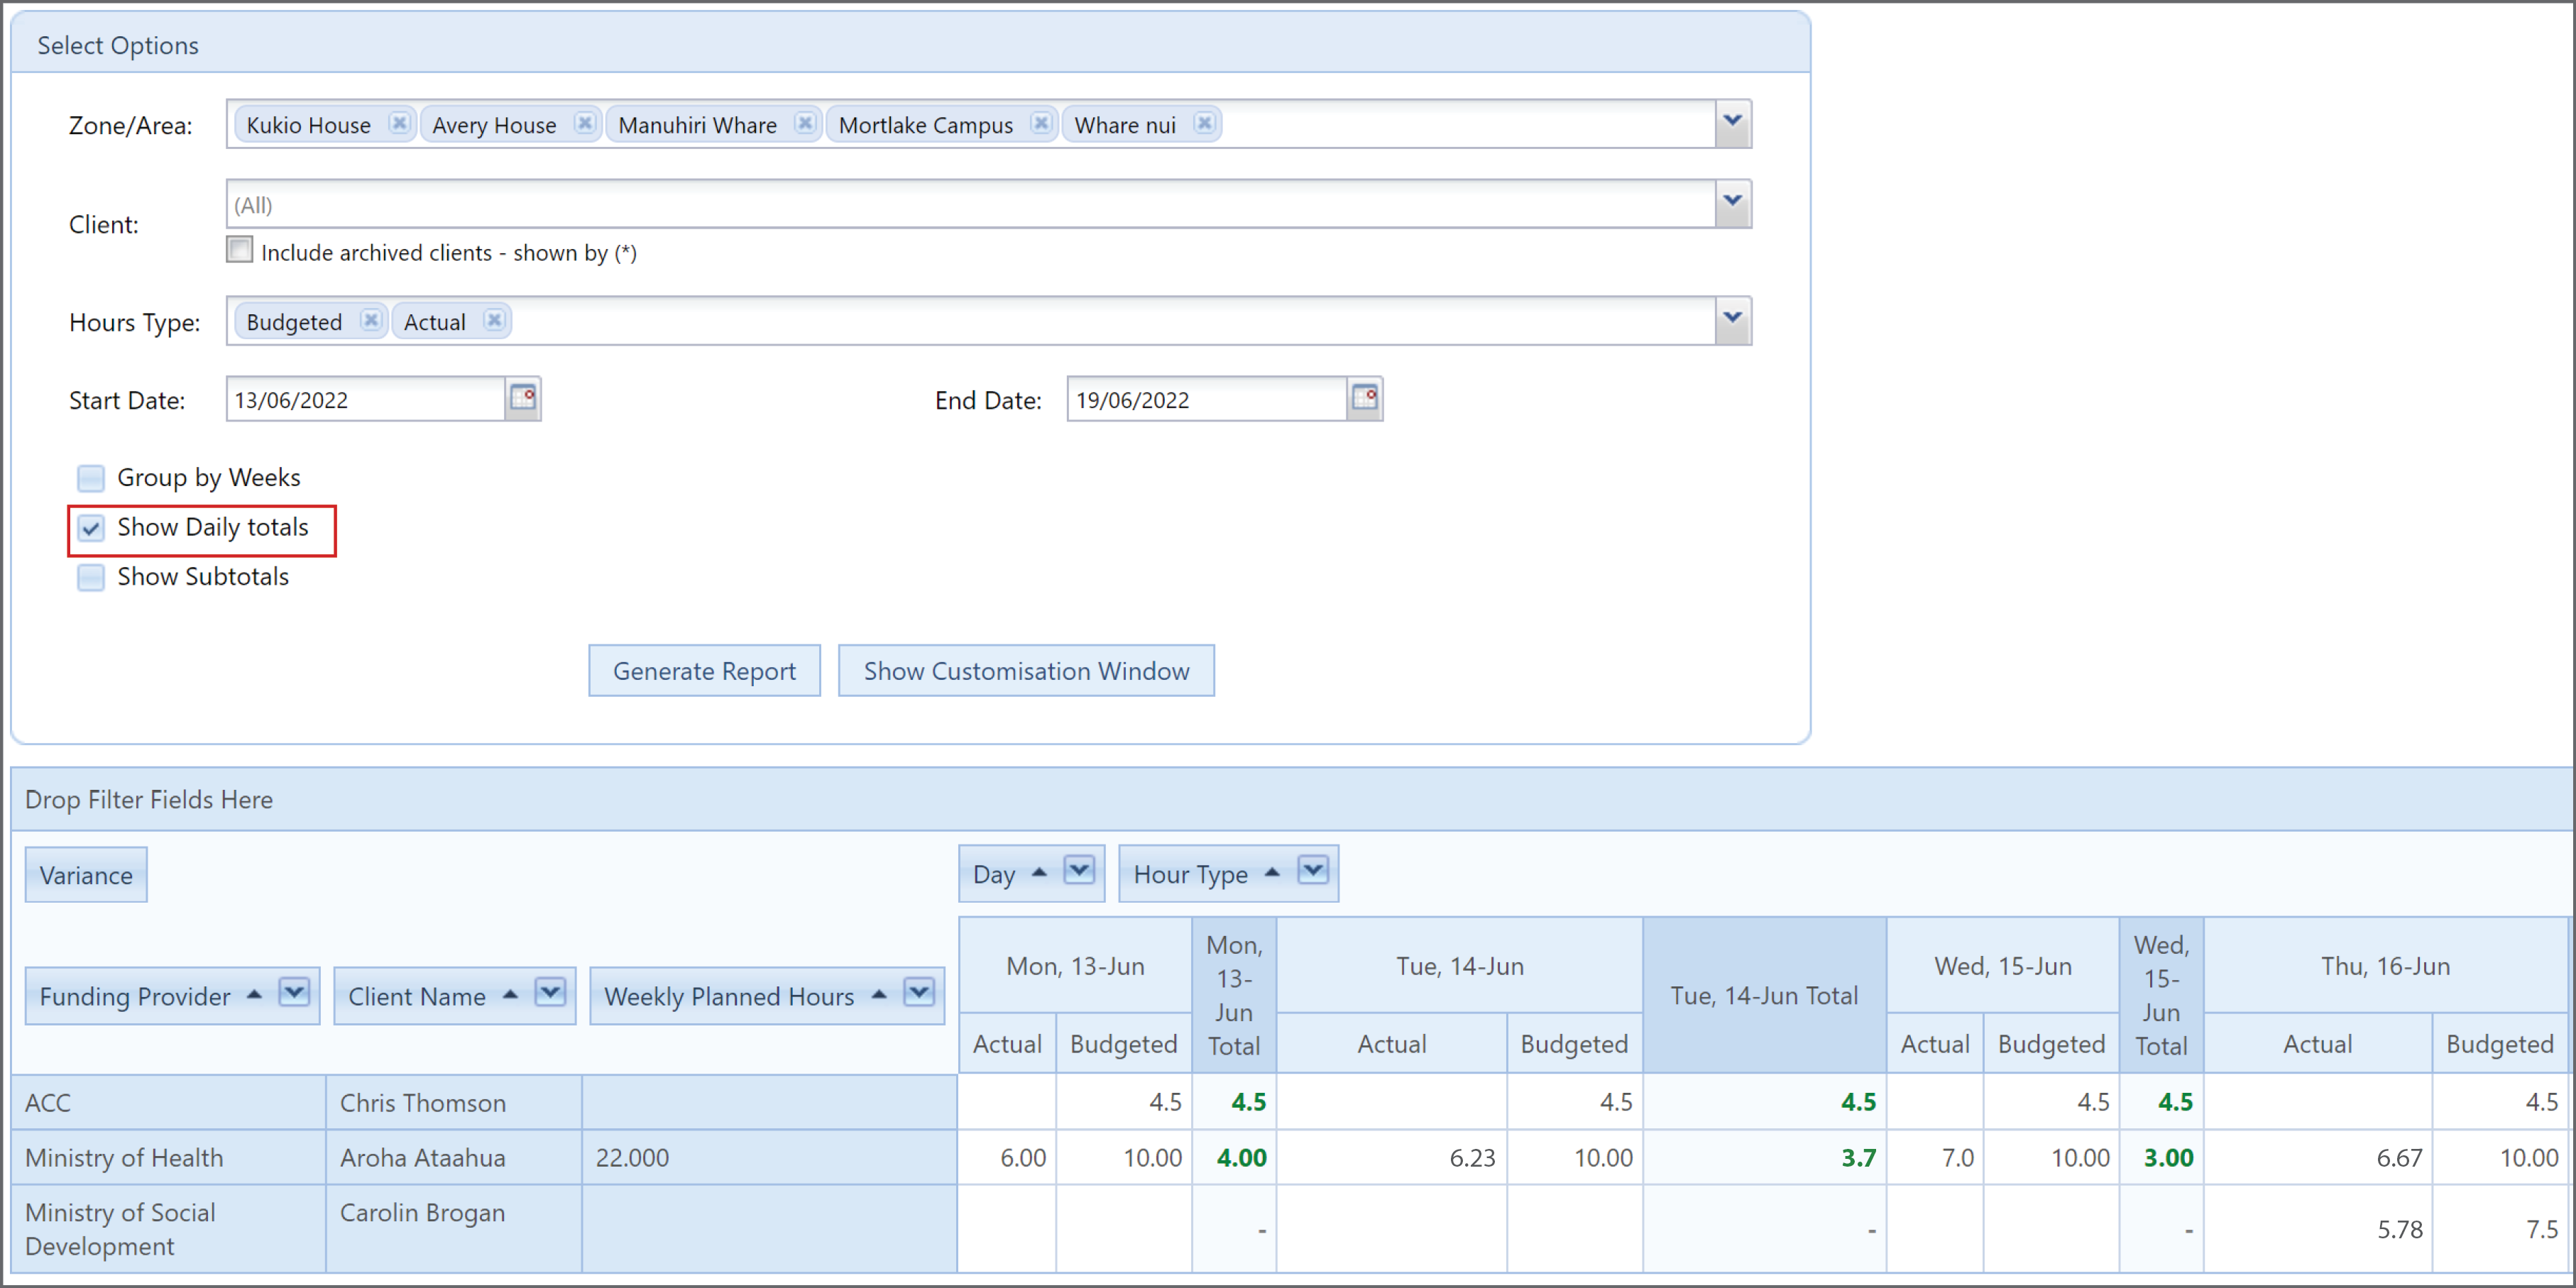
Show Daily Totals: The hours are grouped for each day to daily totals. This helps admin to see which specific days they were over-or-under.
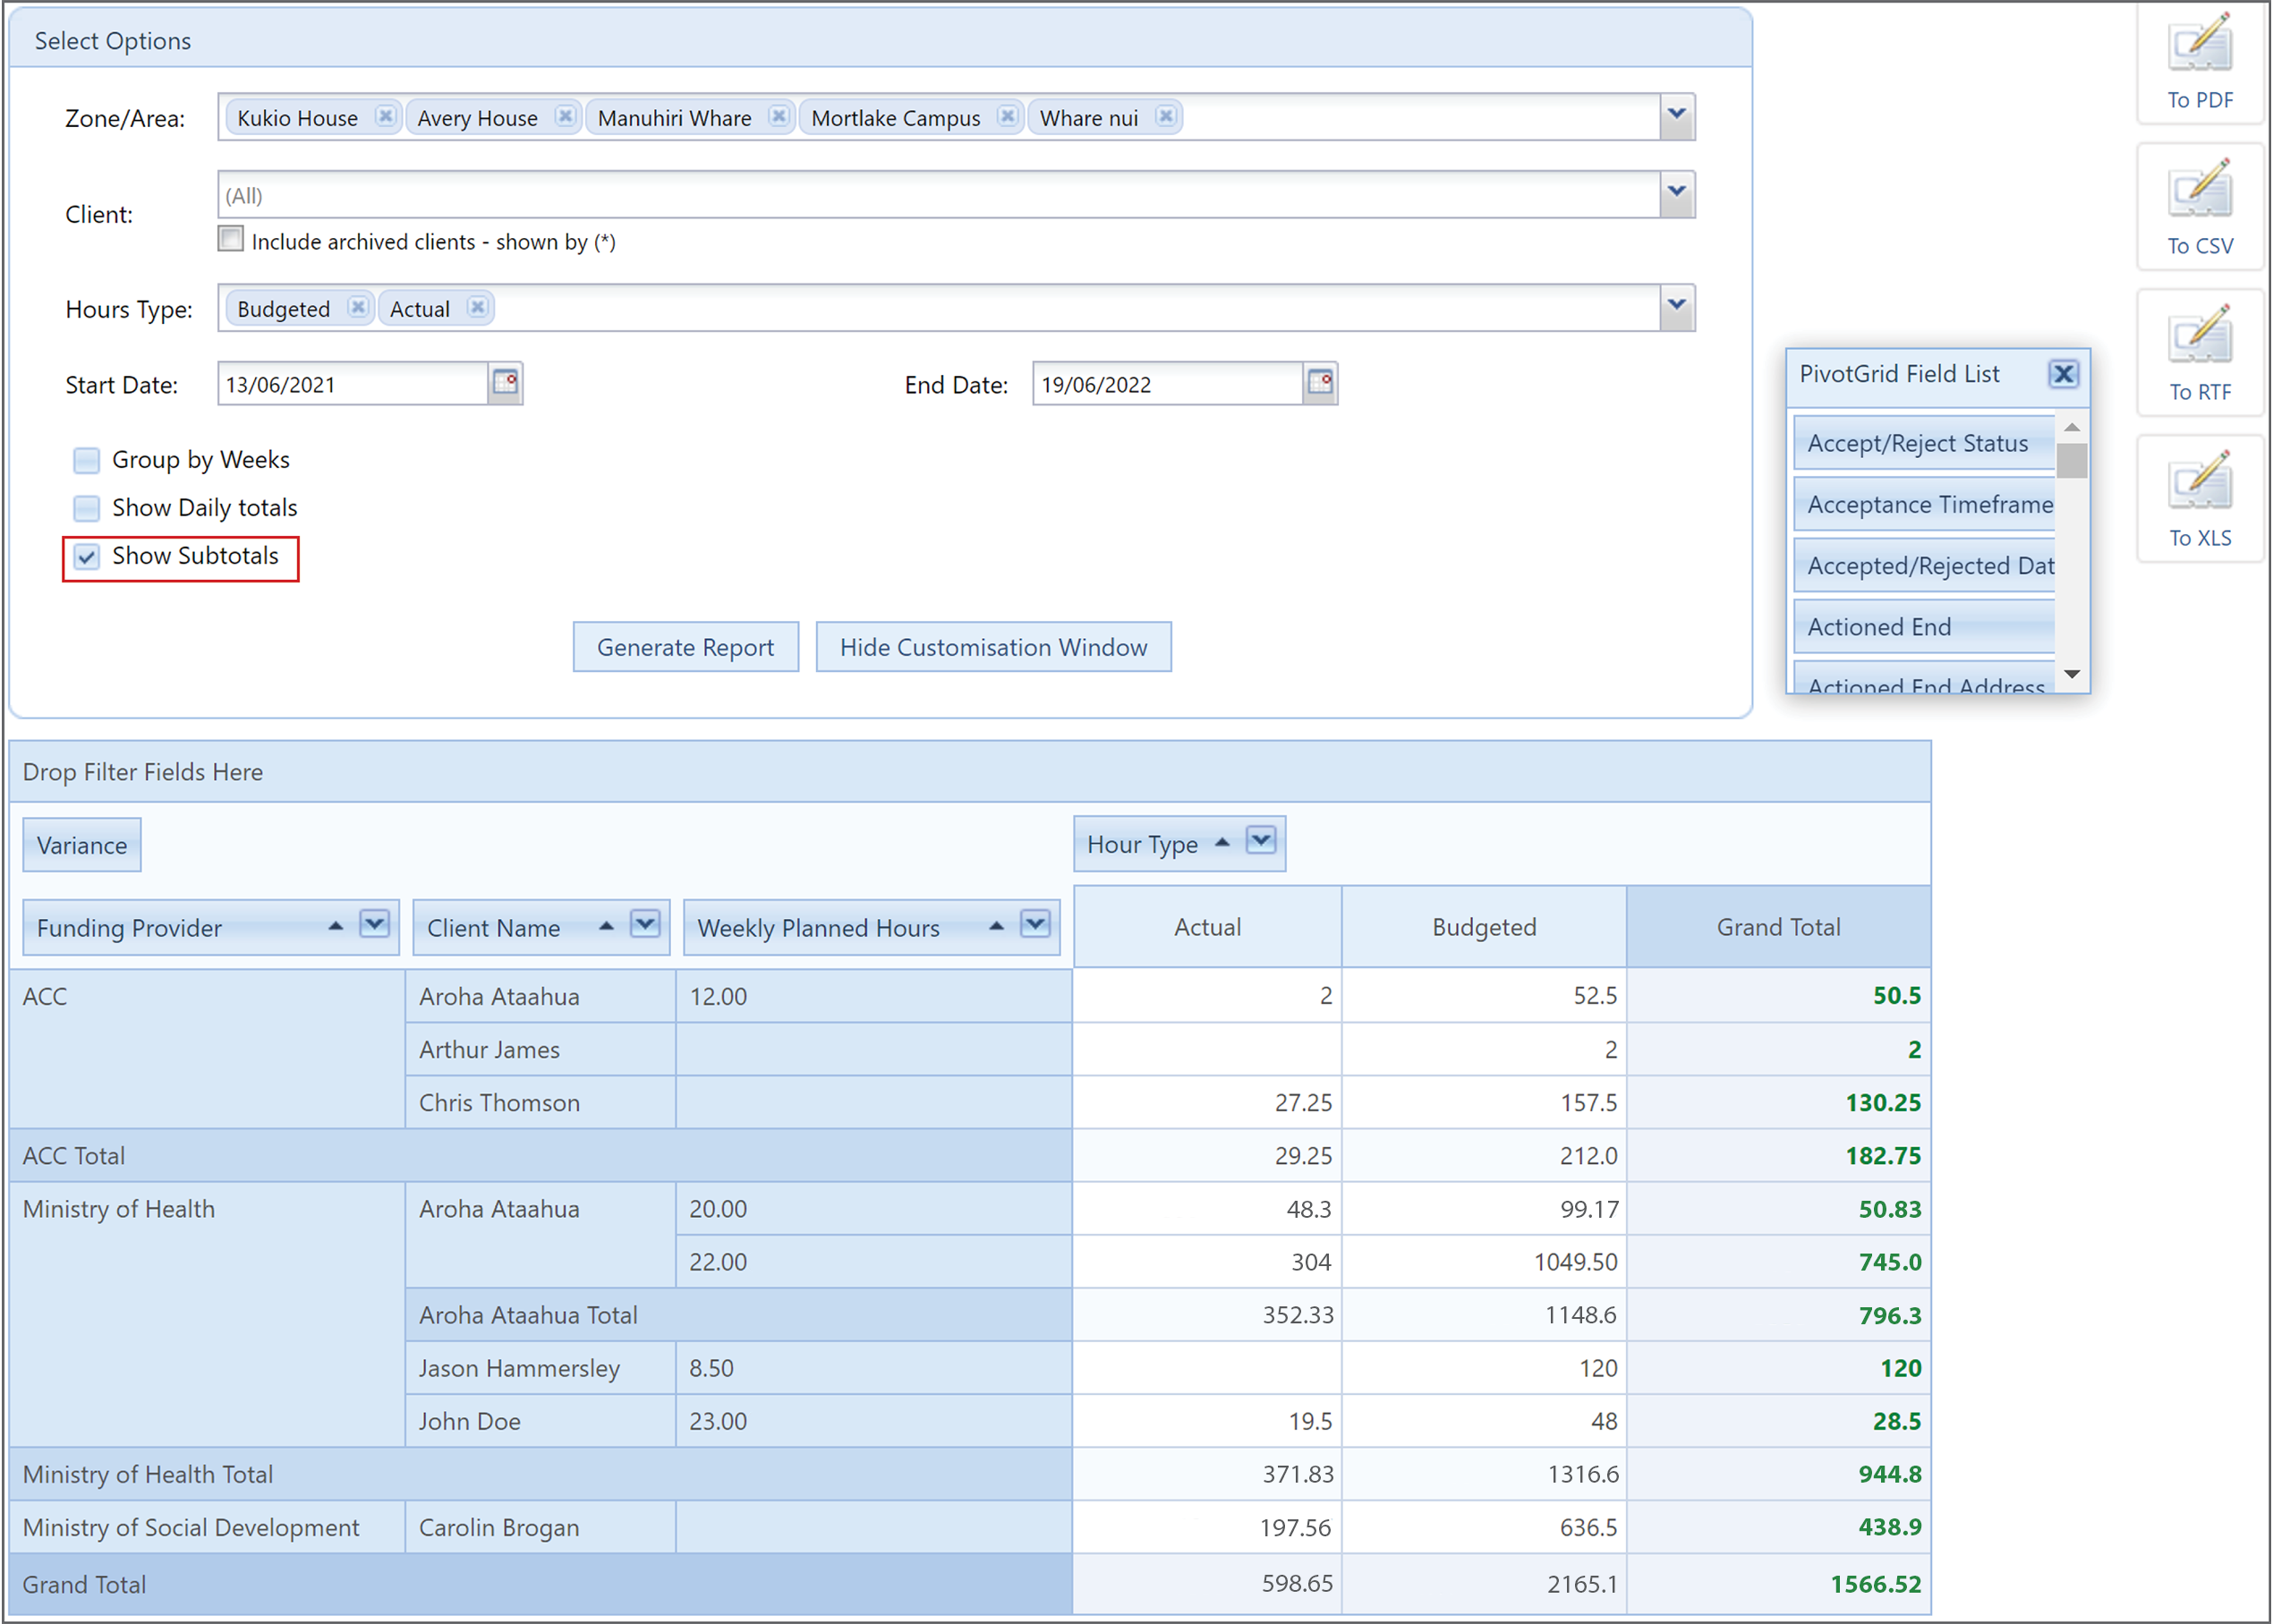
Show Subtotals: Groups the report based on each column (e.g. admin can view the report grouped by Funding Providers). - Generate Report - Click this when you have entered all the relevant information and options. This will generate the report below.
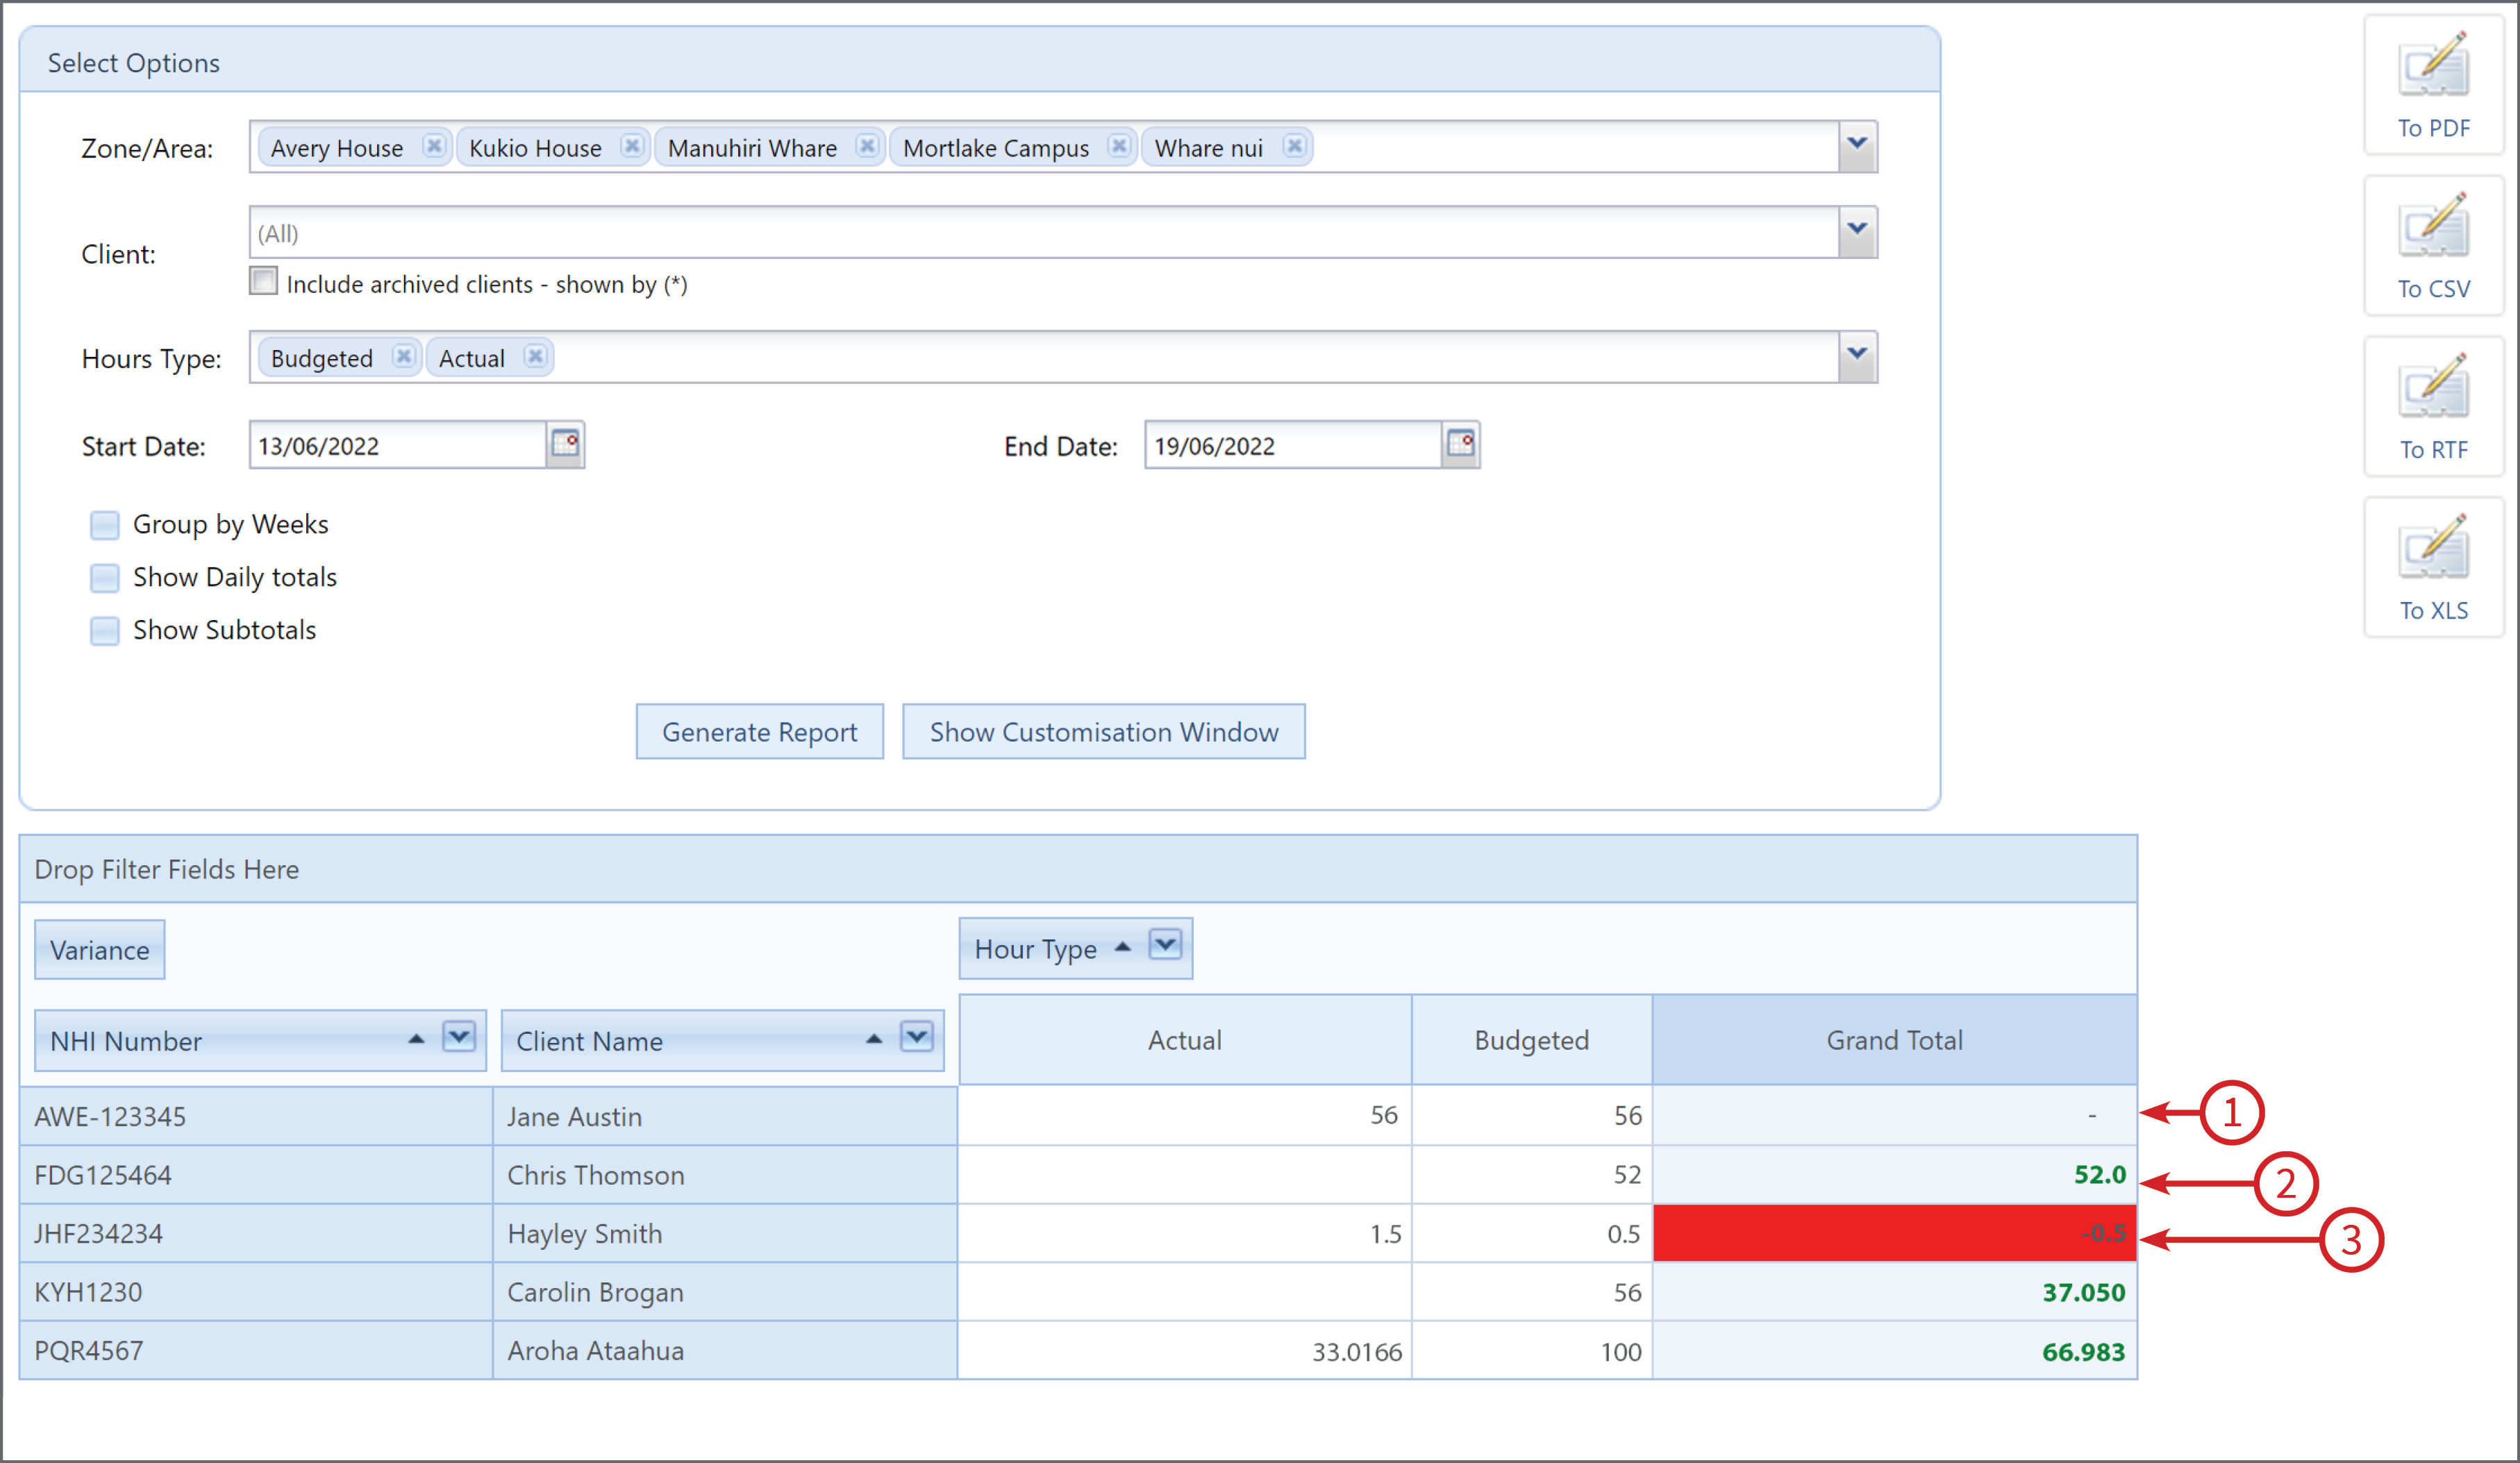
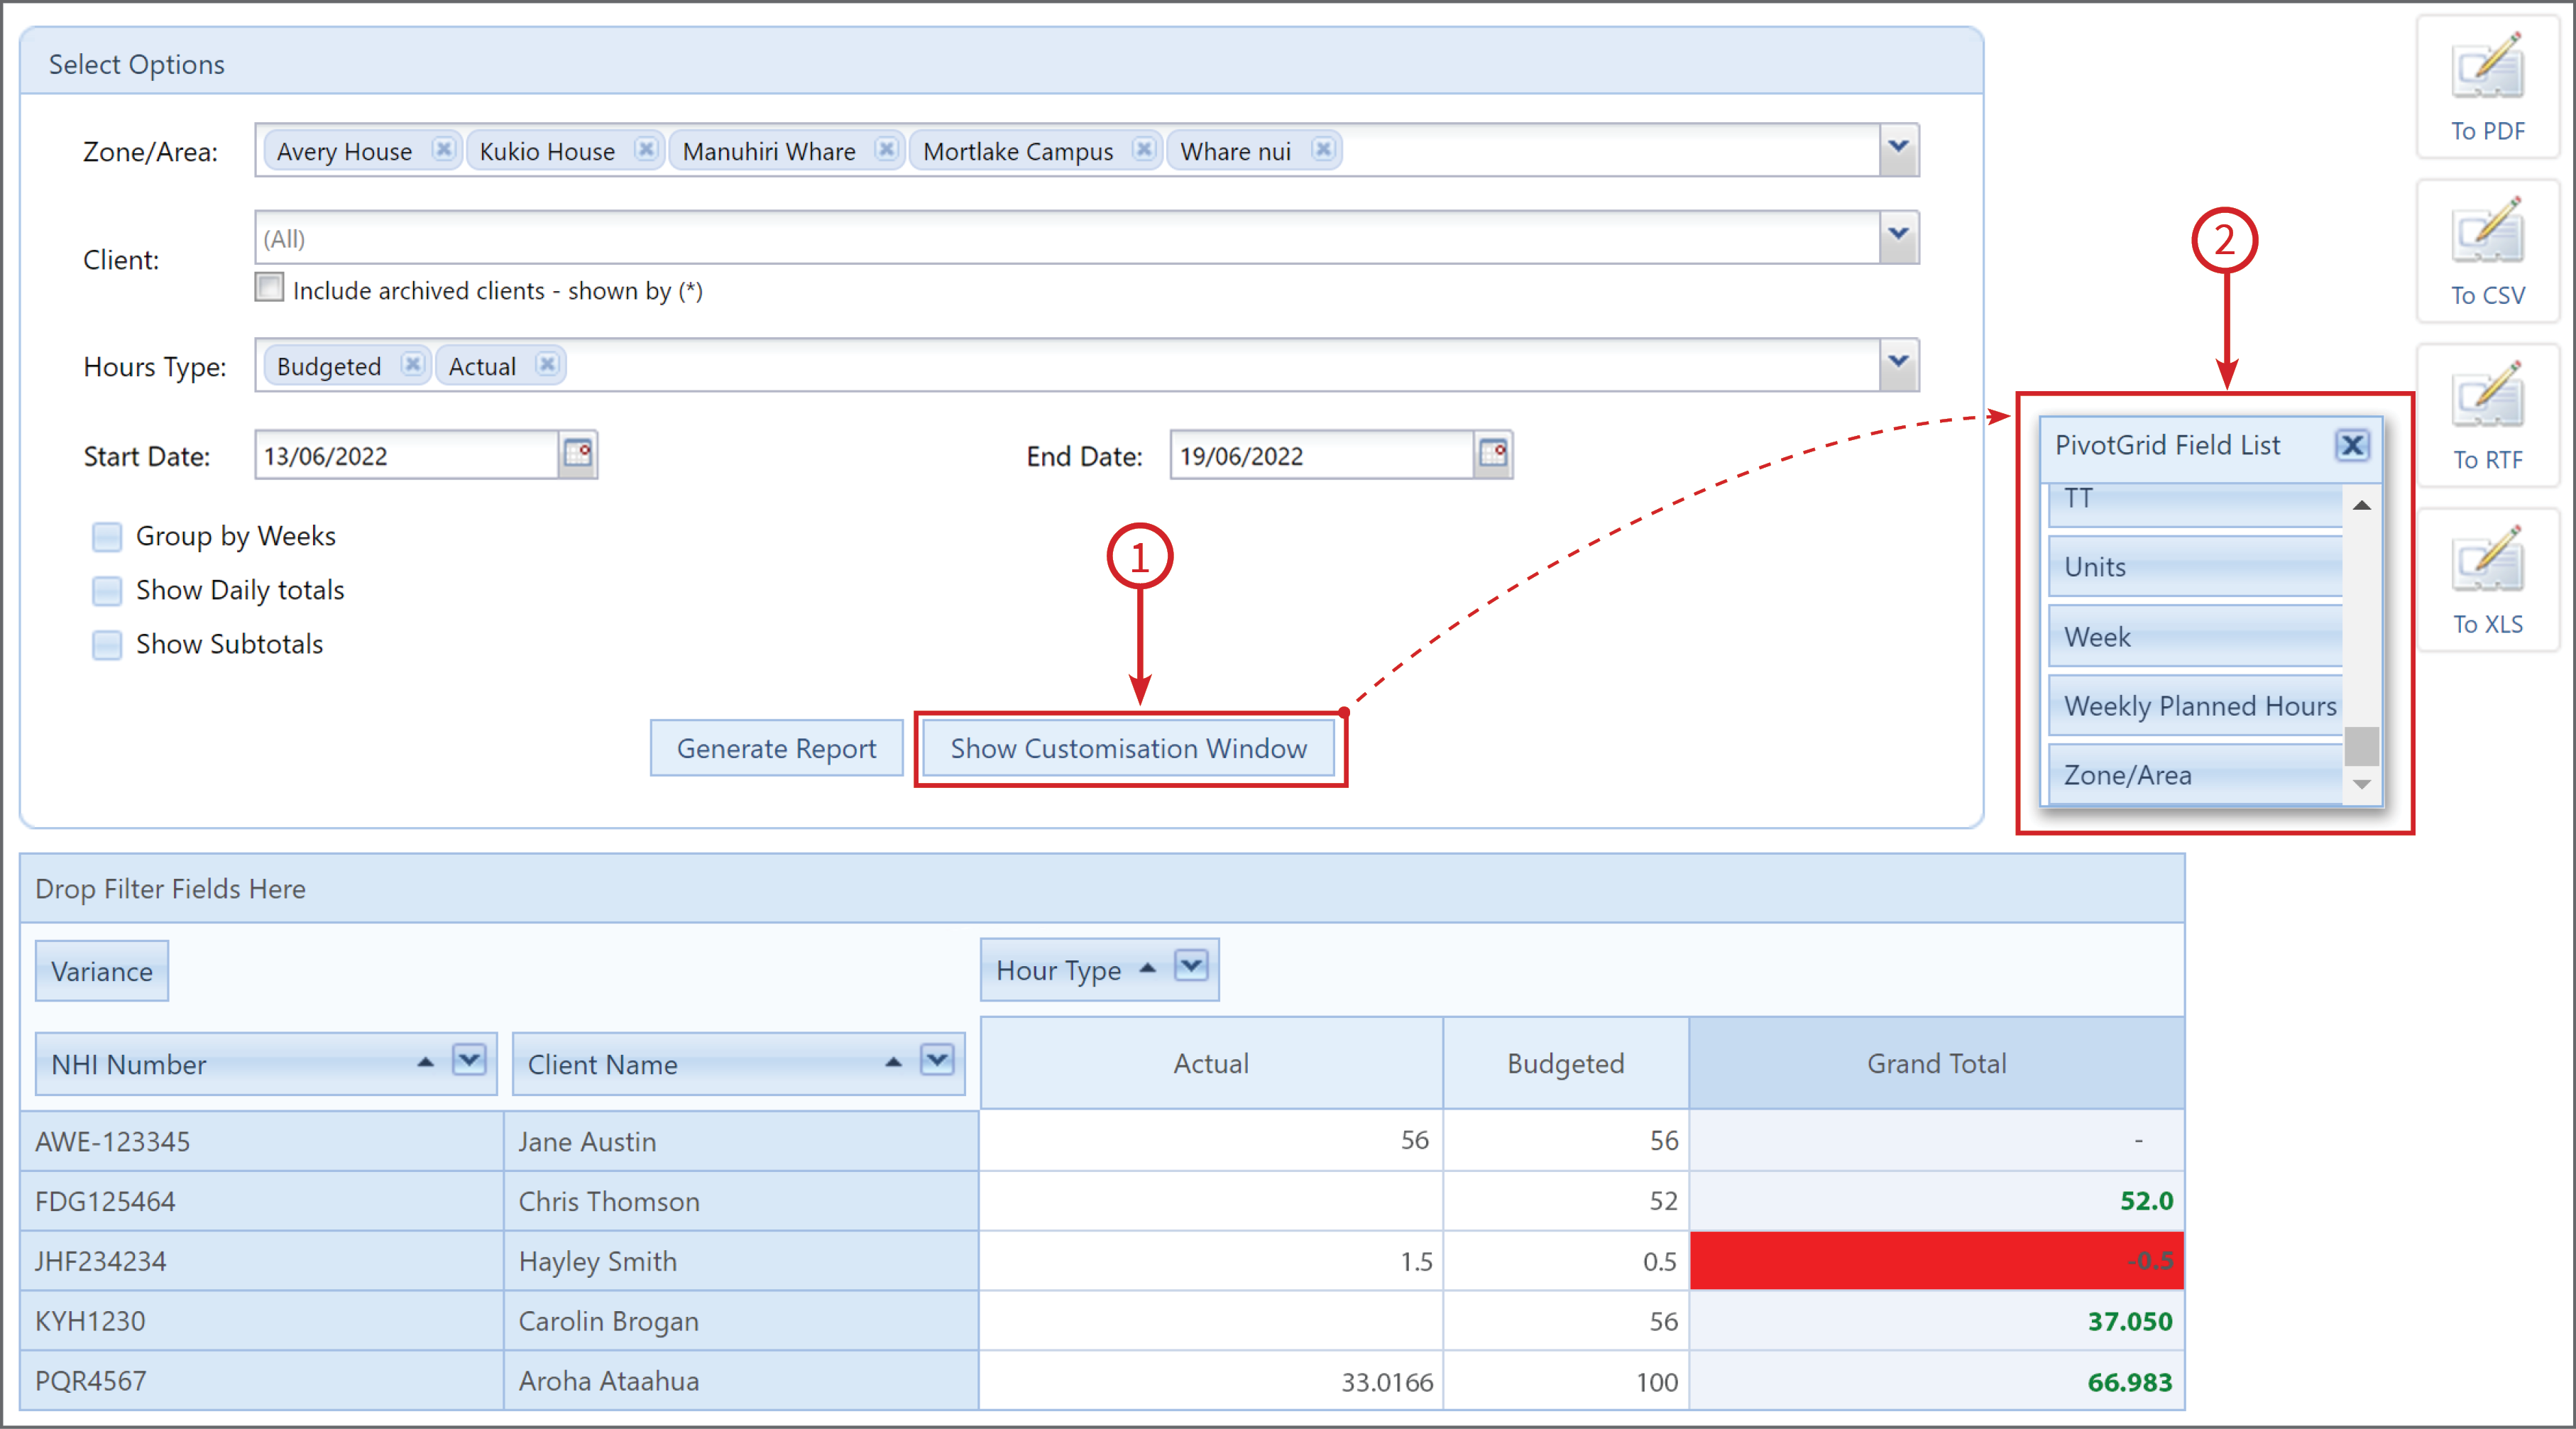
Once Generate Report has been clicked, the report data will pop up below the options box.
- If the hours on the report match, then it will show a nil line.
- Green text is underused hours.
- If actual hours are more than budgeted hours then the colour will be red (i.e. client has overused the quota).
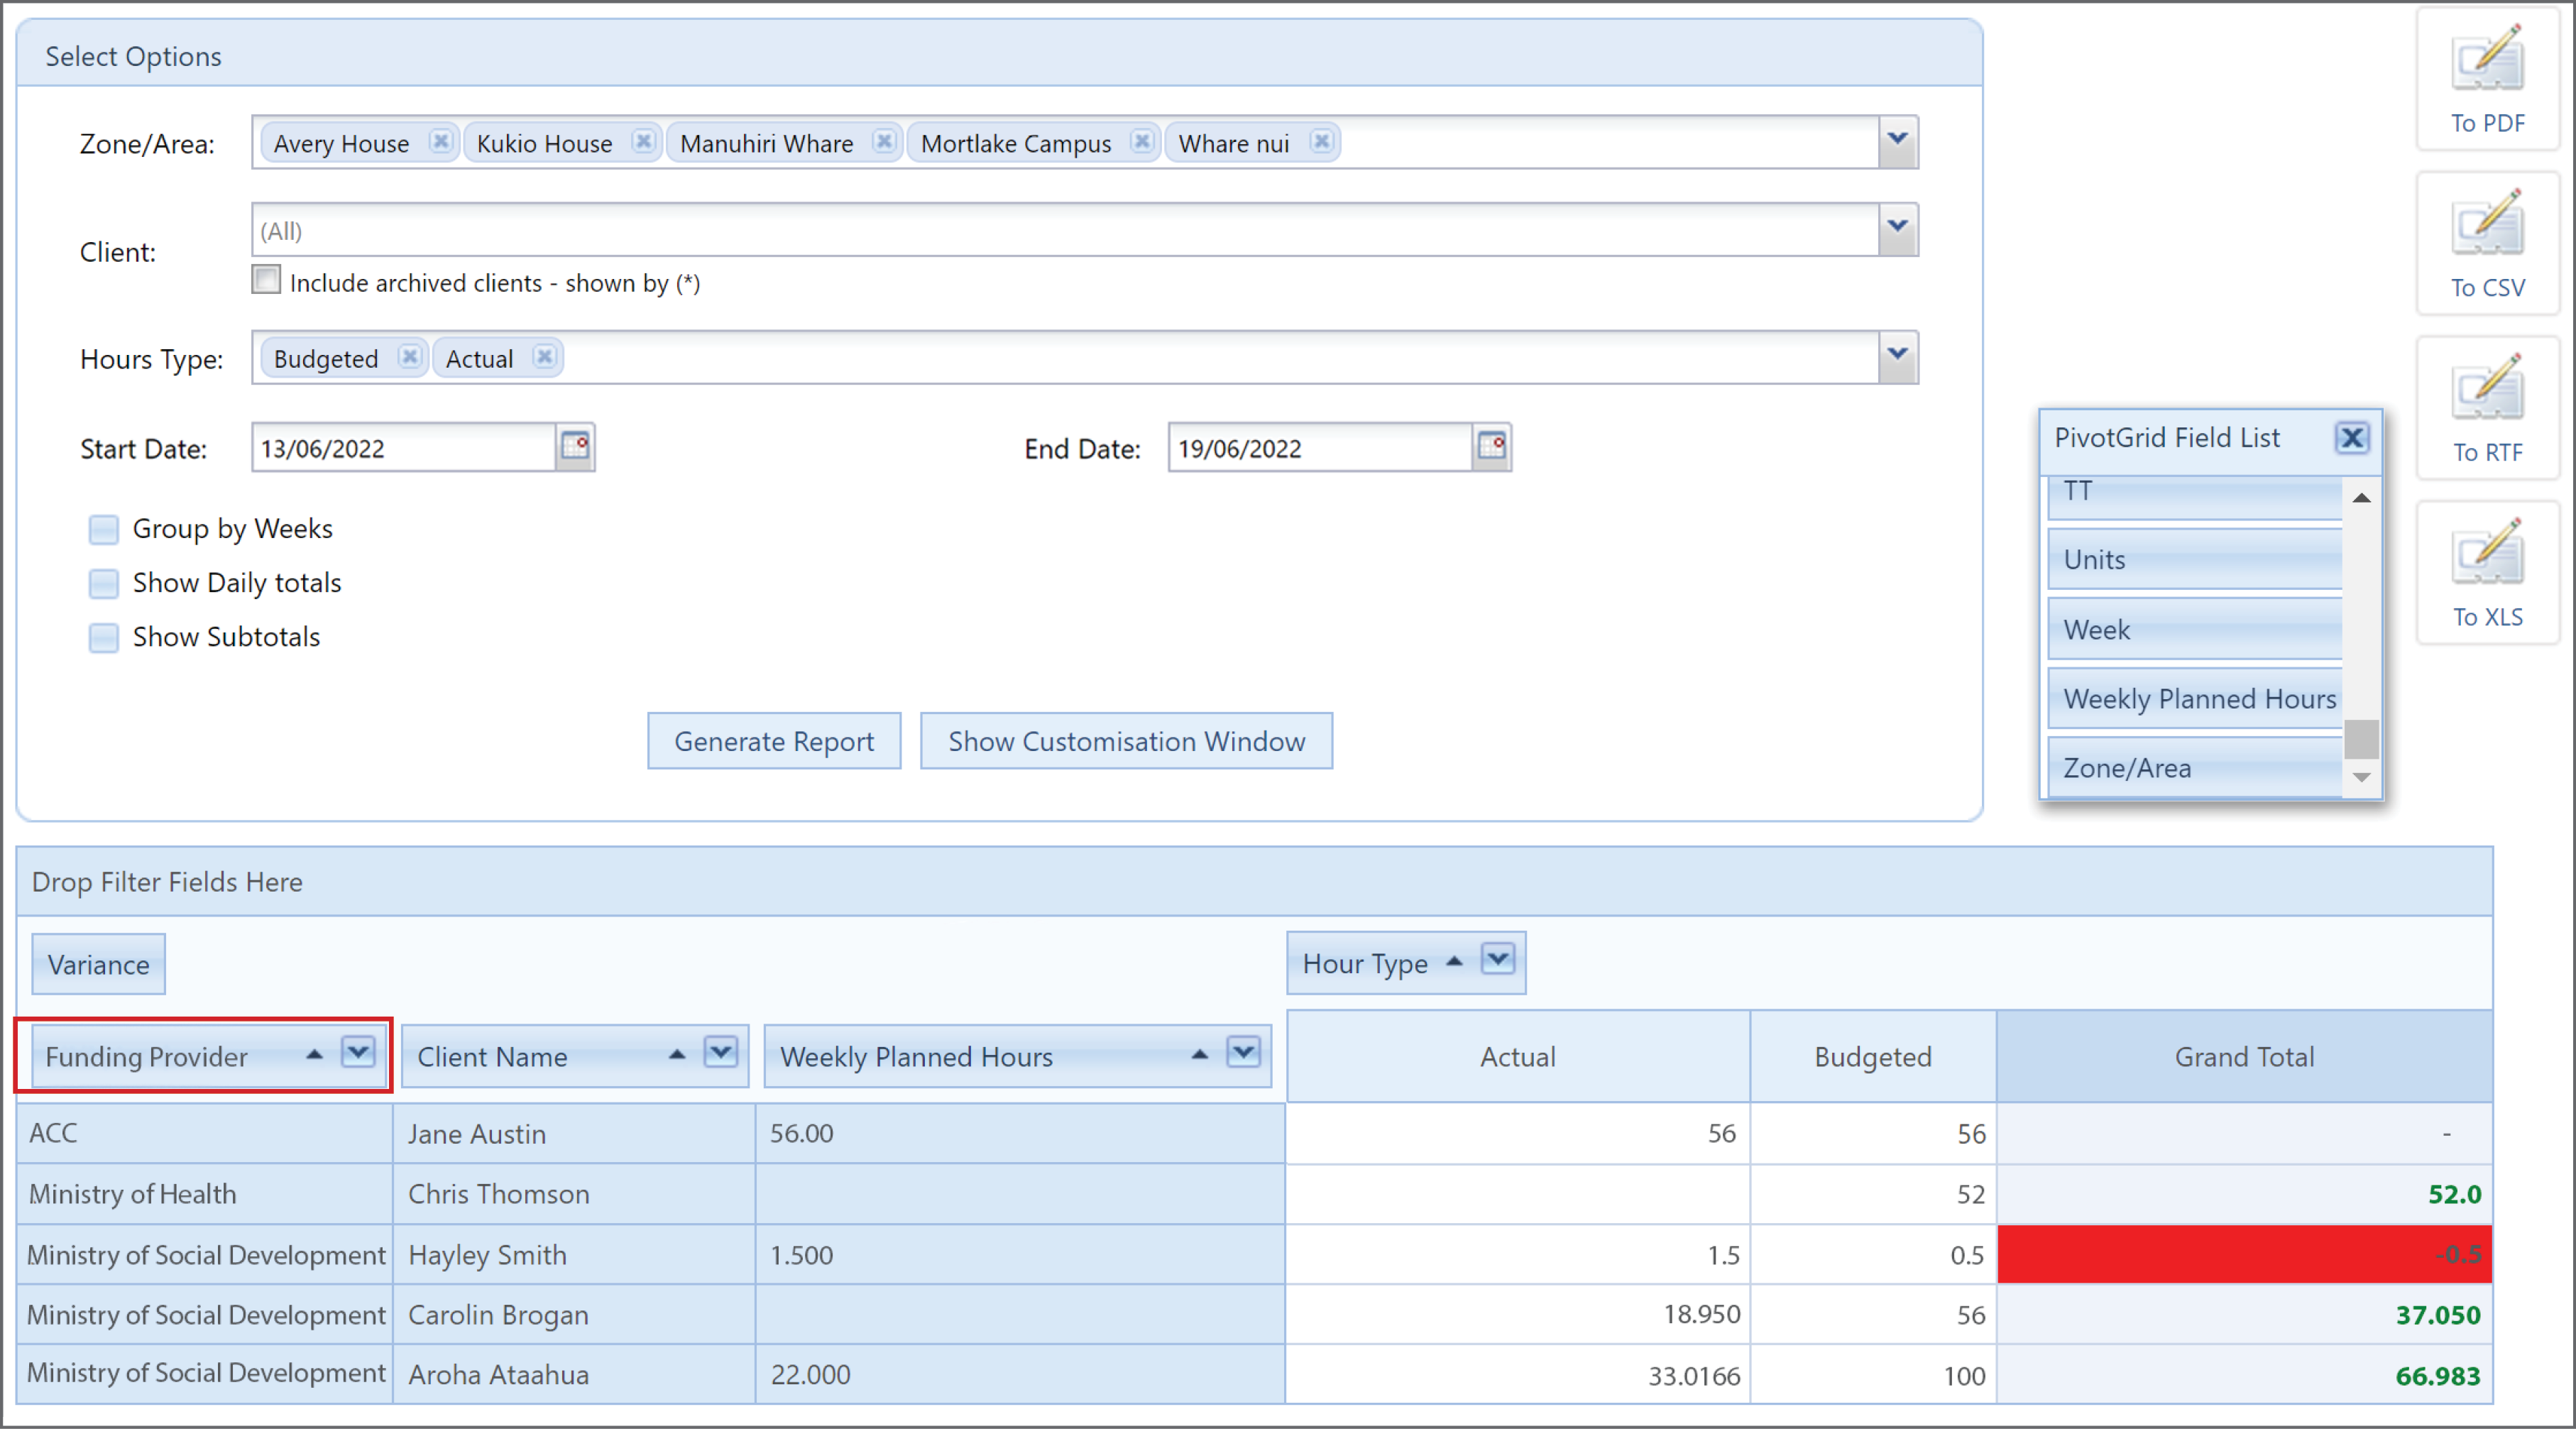
Admin can click on Show Customisation Window (1) to bring up the Field List (2) to drag-drop columns (e.g. add ‘Weekly Planned Hours’ to see how many hours the ministry contract is; add ‘Funding Provider’ to group the hours by each funding provider)
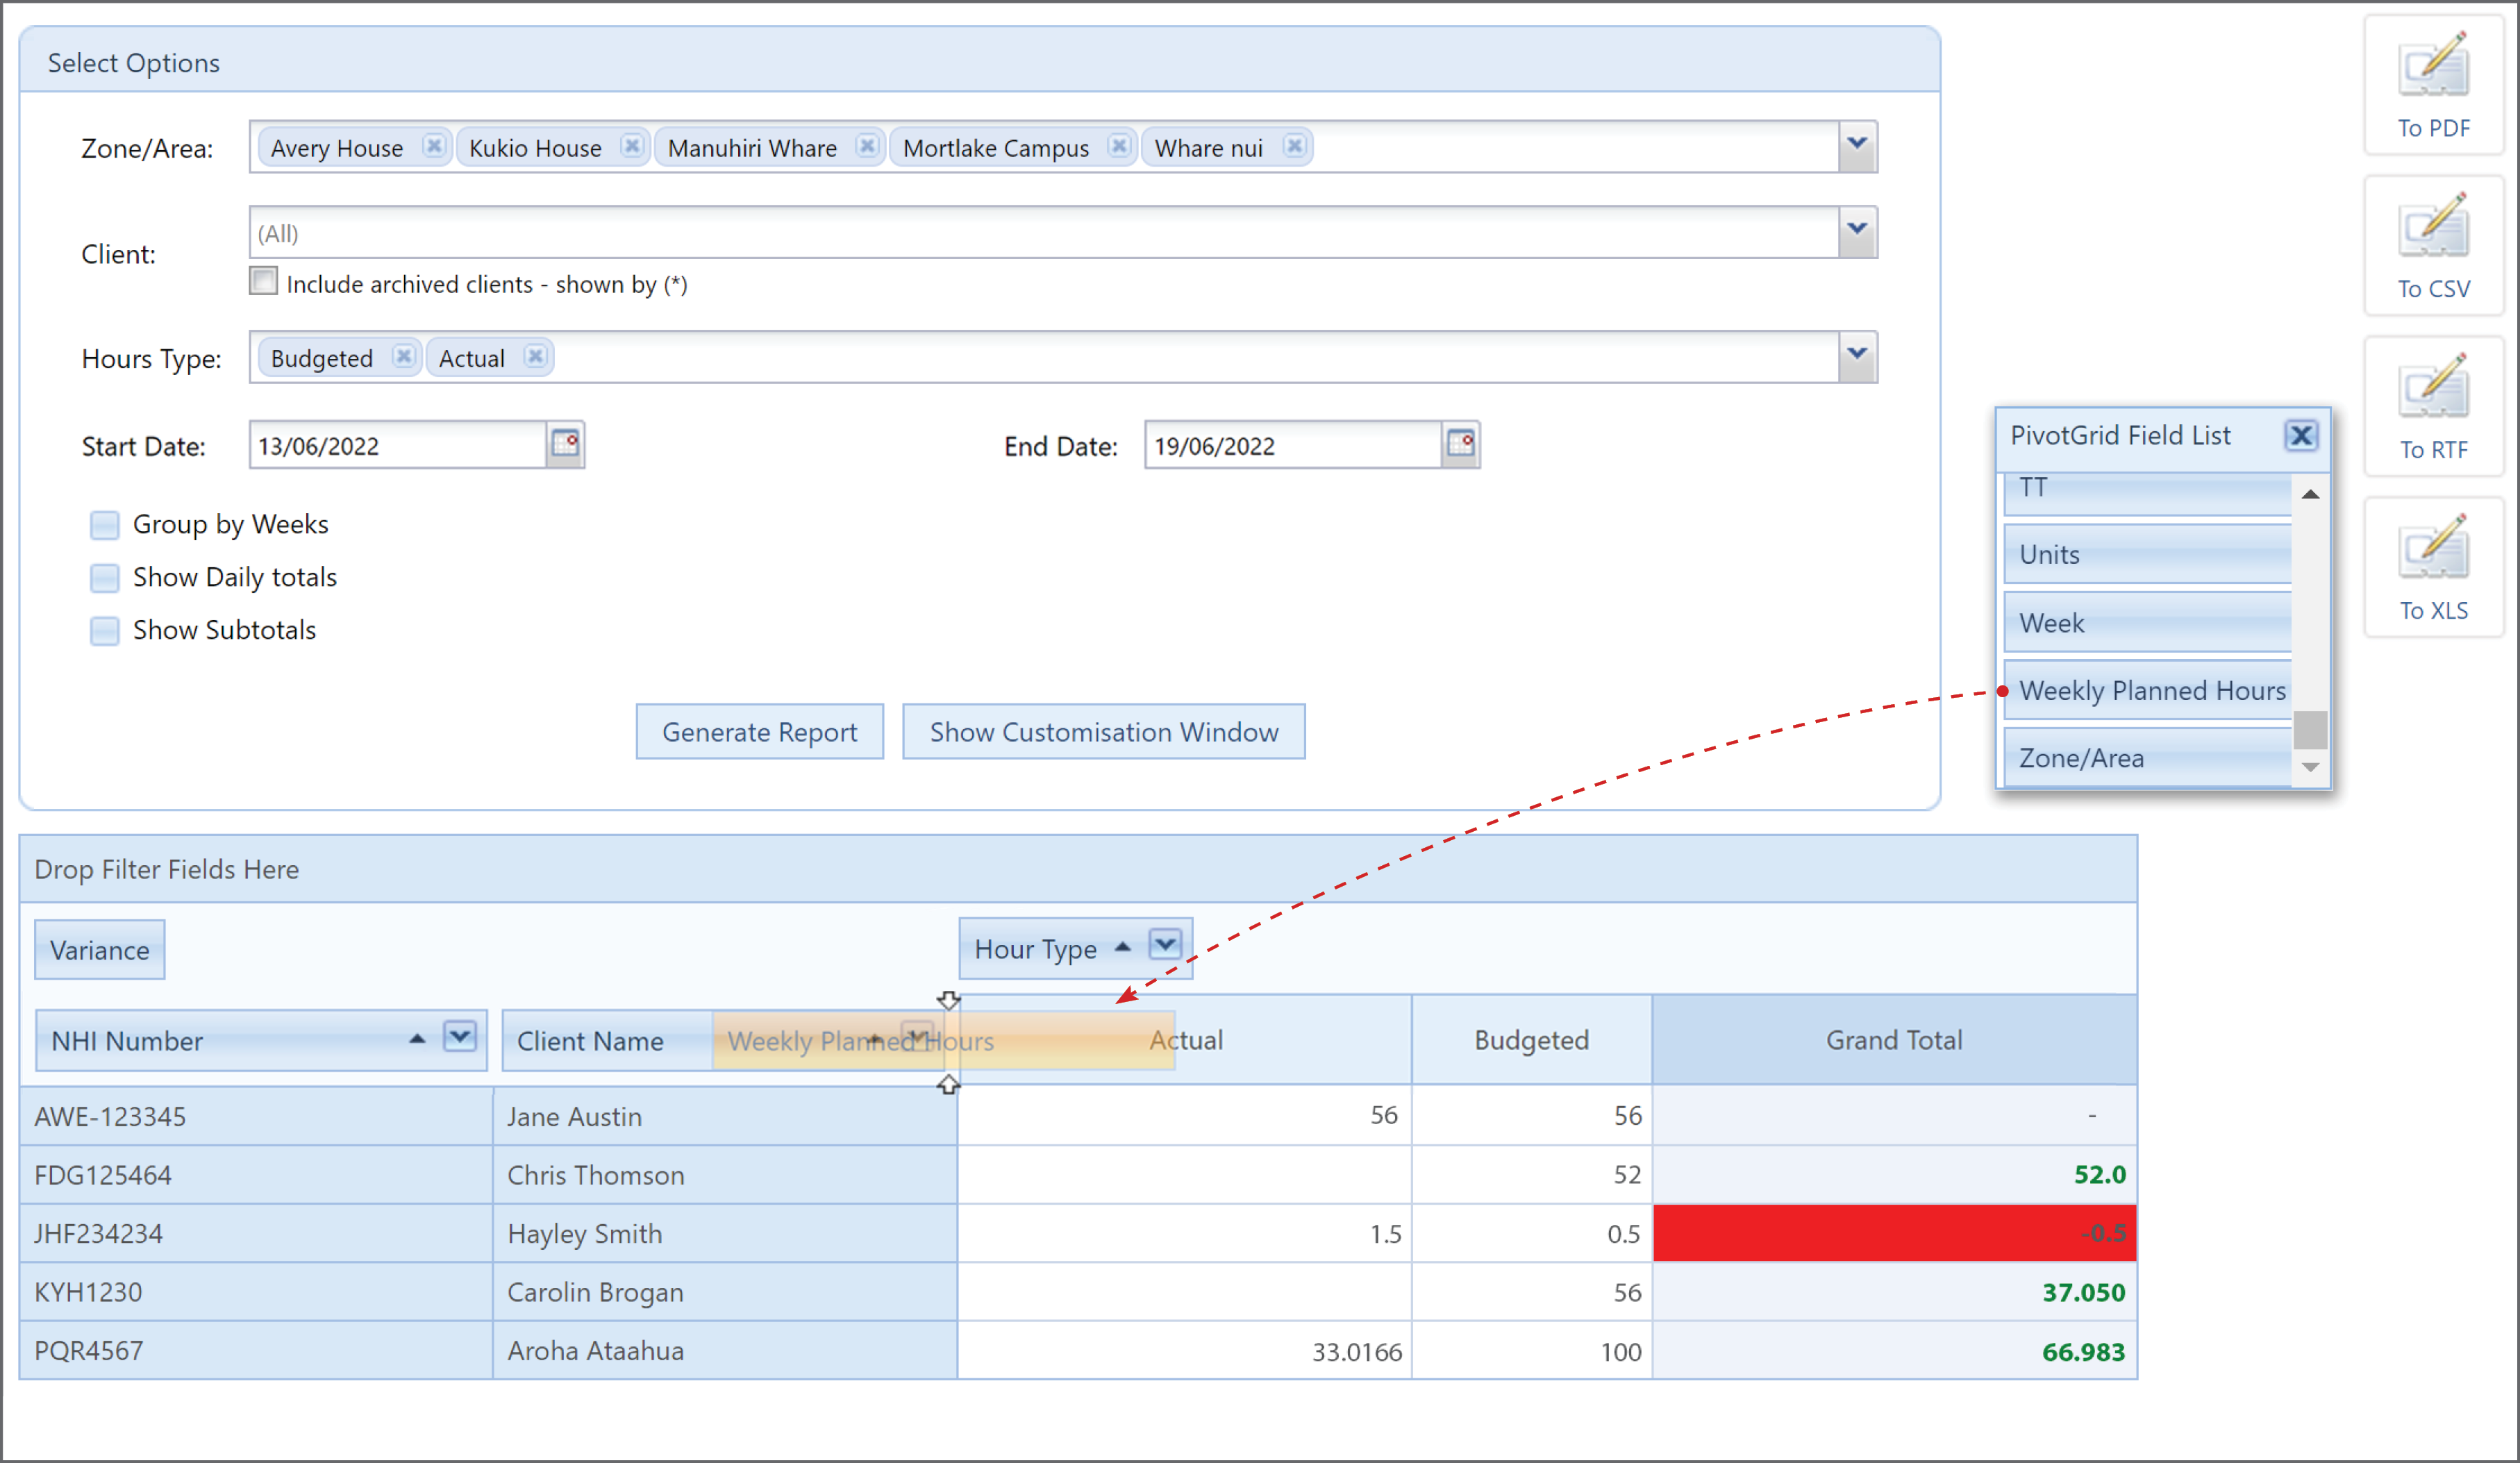
Simply find the field you would like to add from the Field List list and drag it to the report. You will see below that the orange Weekly Planned Hours field is being dropped into the report, two arrows appear to show you where to place it.
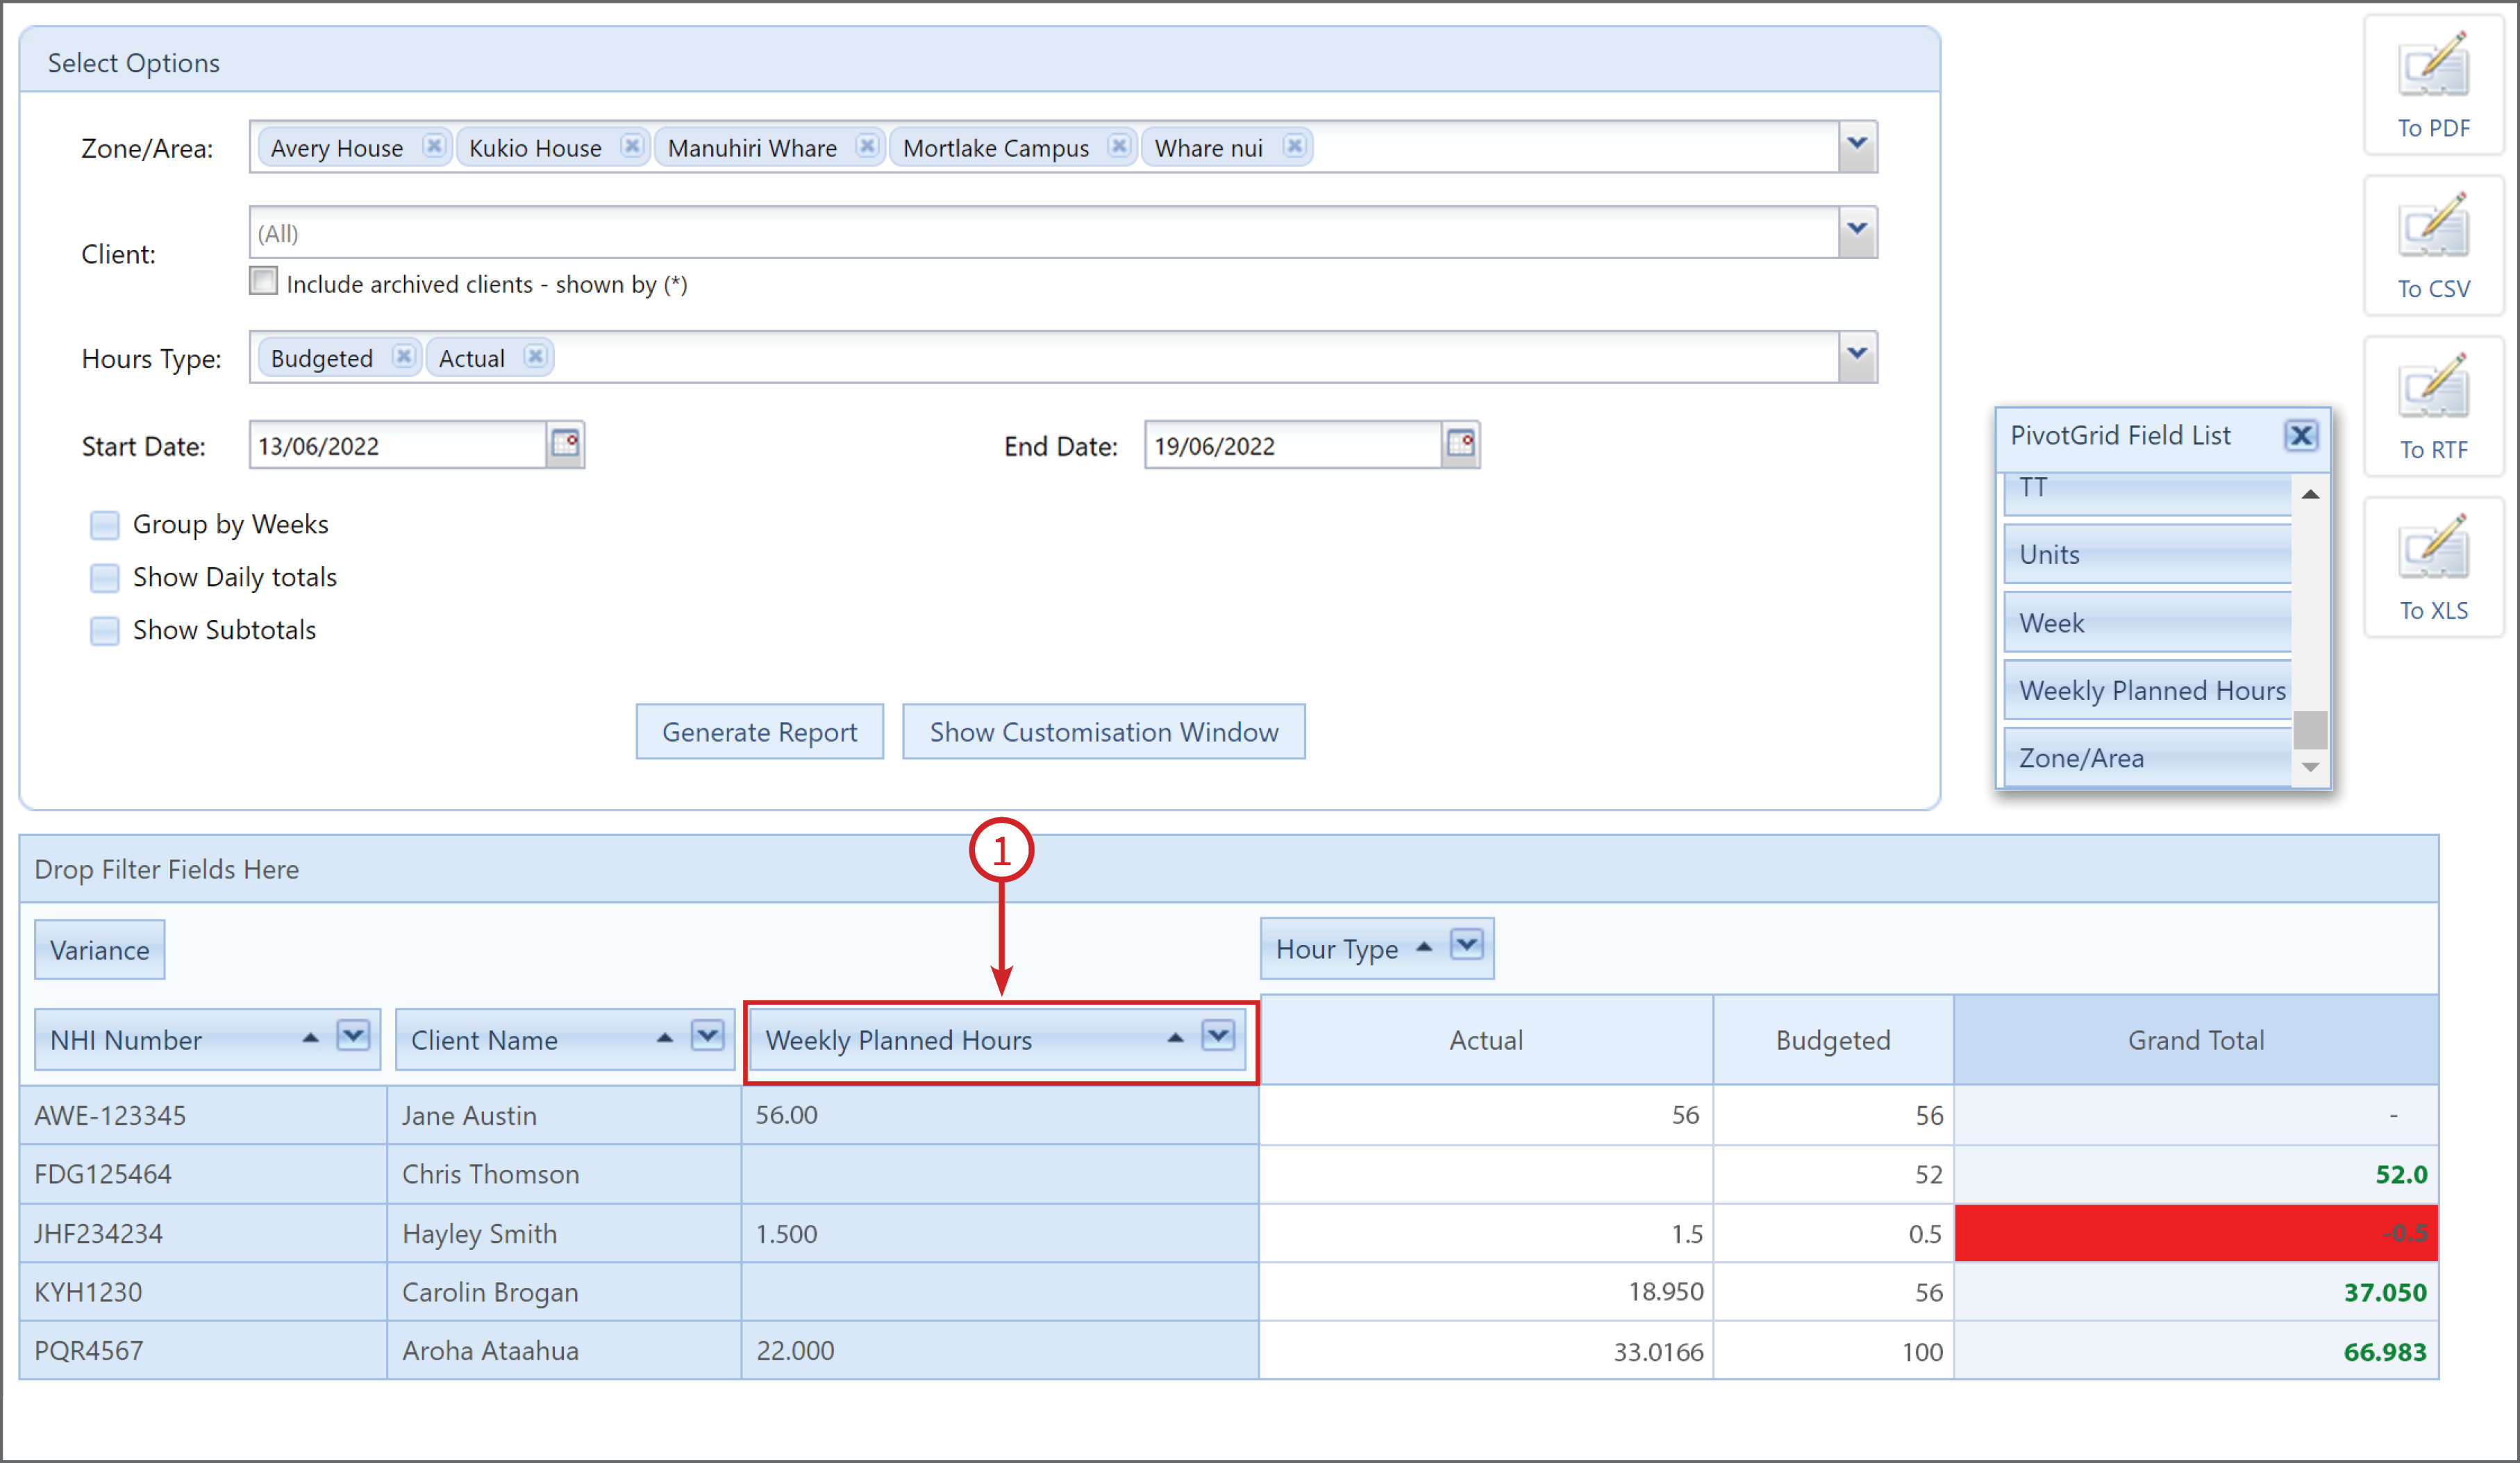
In the example below the Weekly Planned Hours (1) field has been placed and the data has been added to the report.
To remove a field from the report, just drag and drop it back to the Field List box.
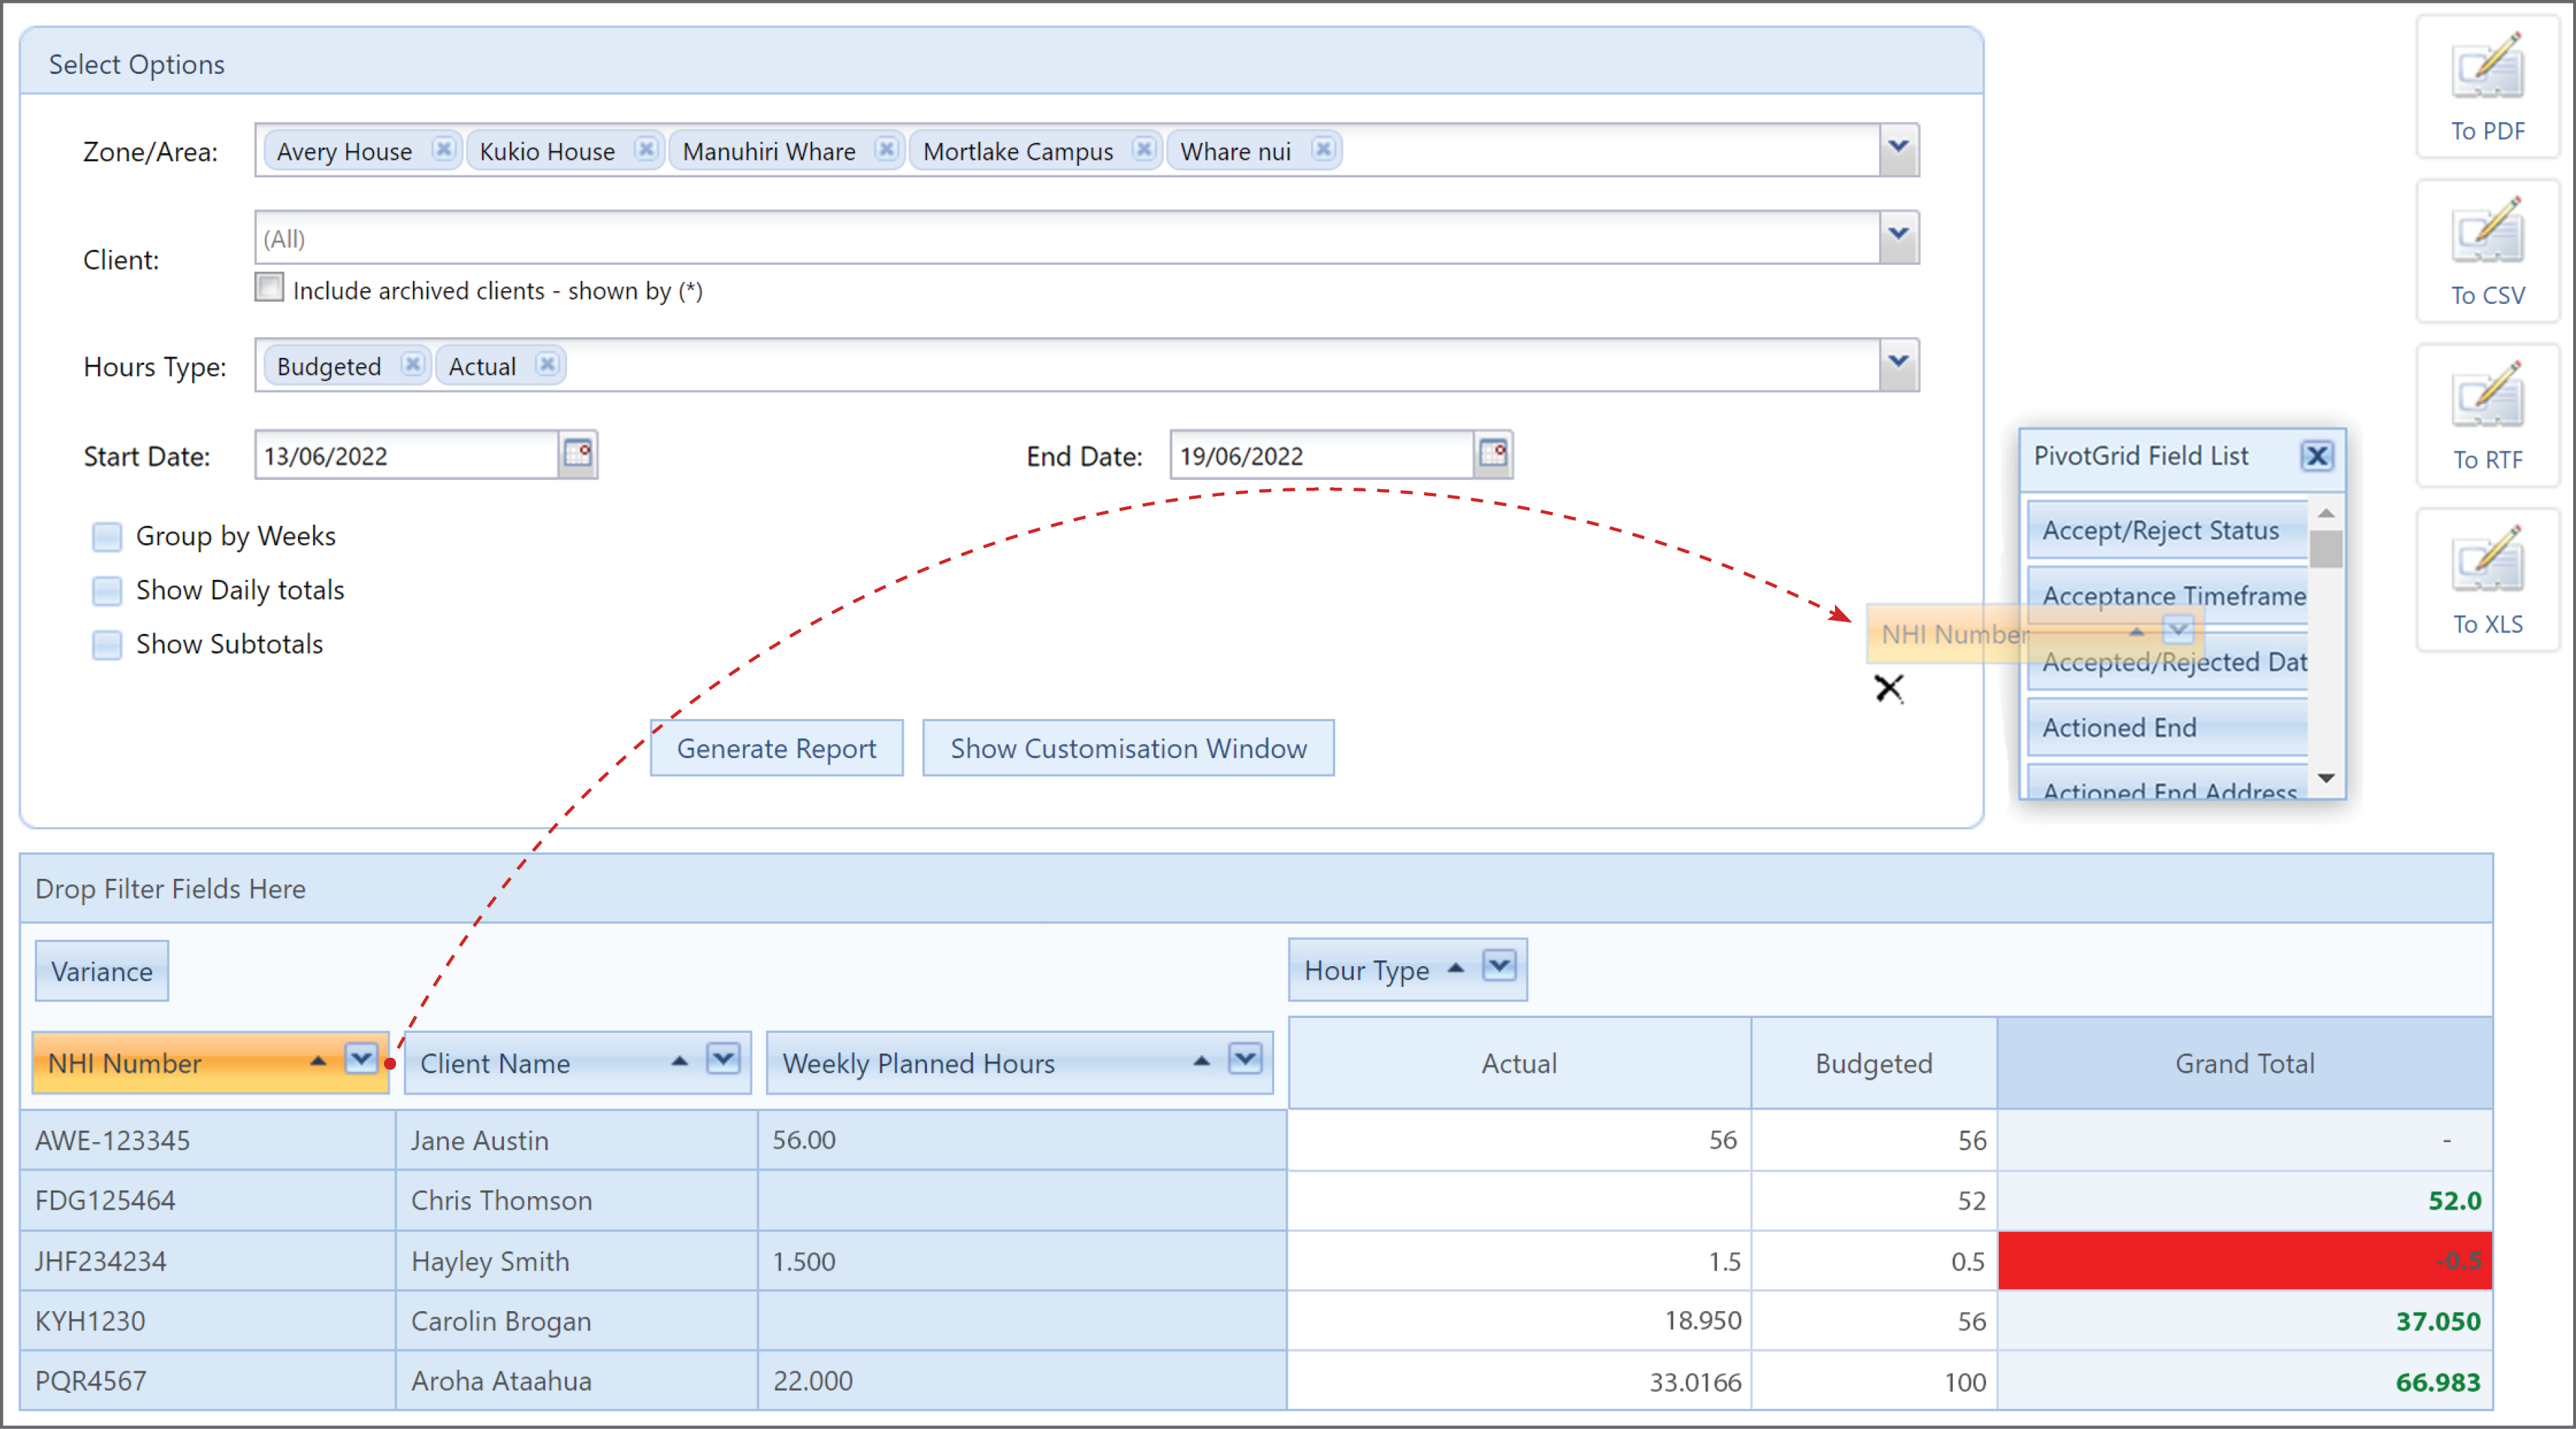
In the example below, we have removed the NHI Number column and added the Funding Provider field, this groups the hours by each funding provider.
You can also tick the Group by Weeks, Show Daily Totals or/and Show Subtotals at any stage, then click Generate Report and the information will be reloaded and sorted to your new options.
Below is an example of Group by Weeks:
Below is an example of Show Daily Totals:
Below is an example of Show Subtotals:
You can also tick multiple:
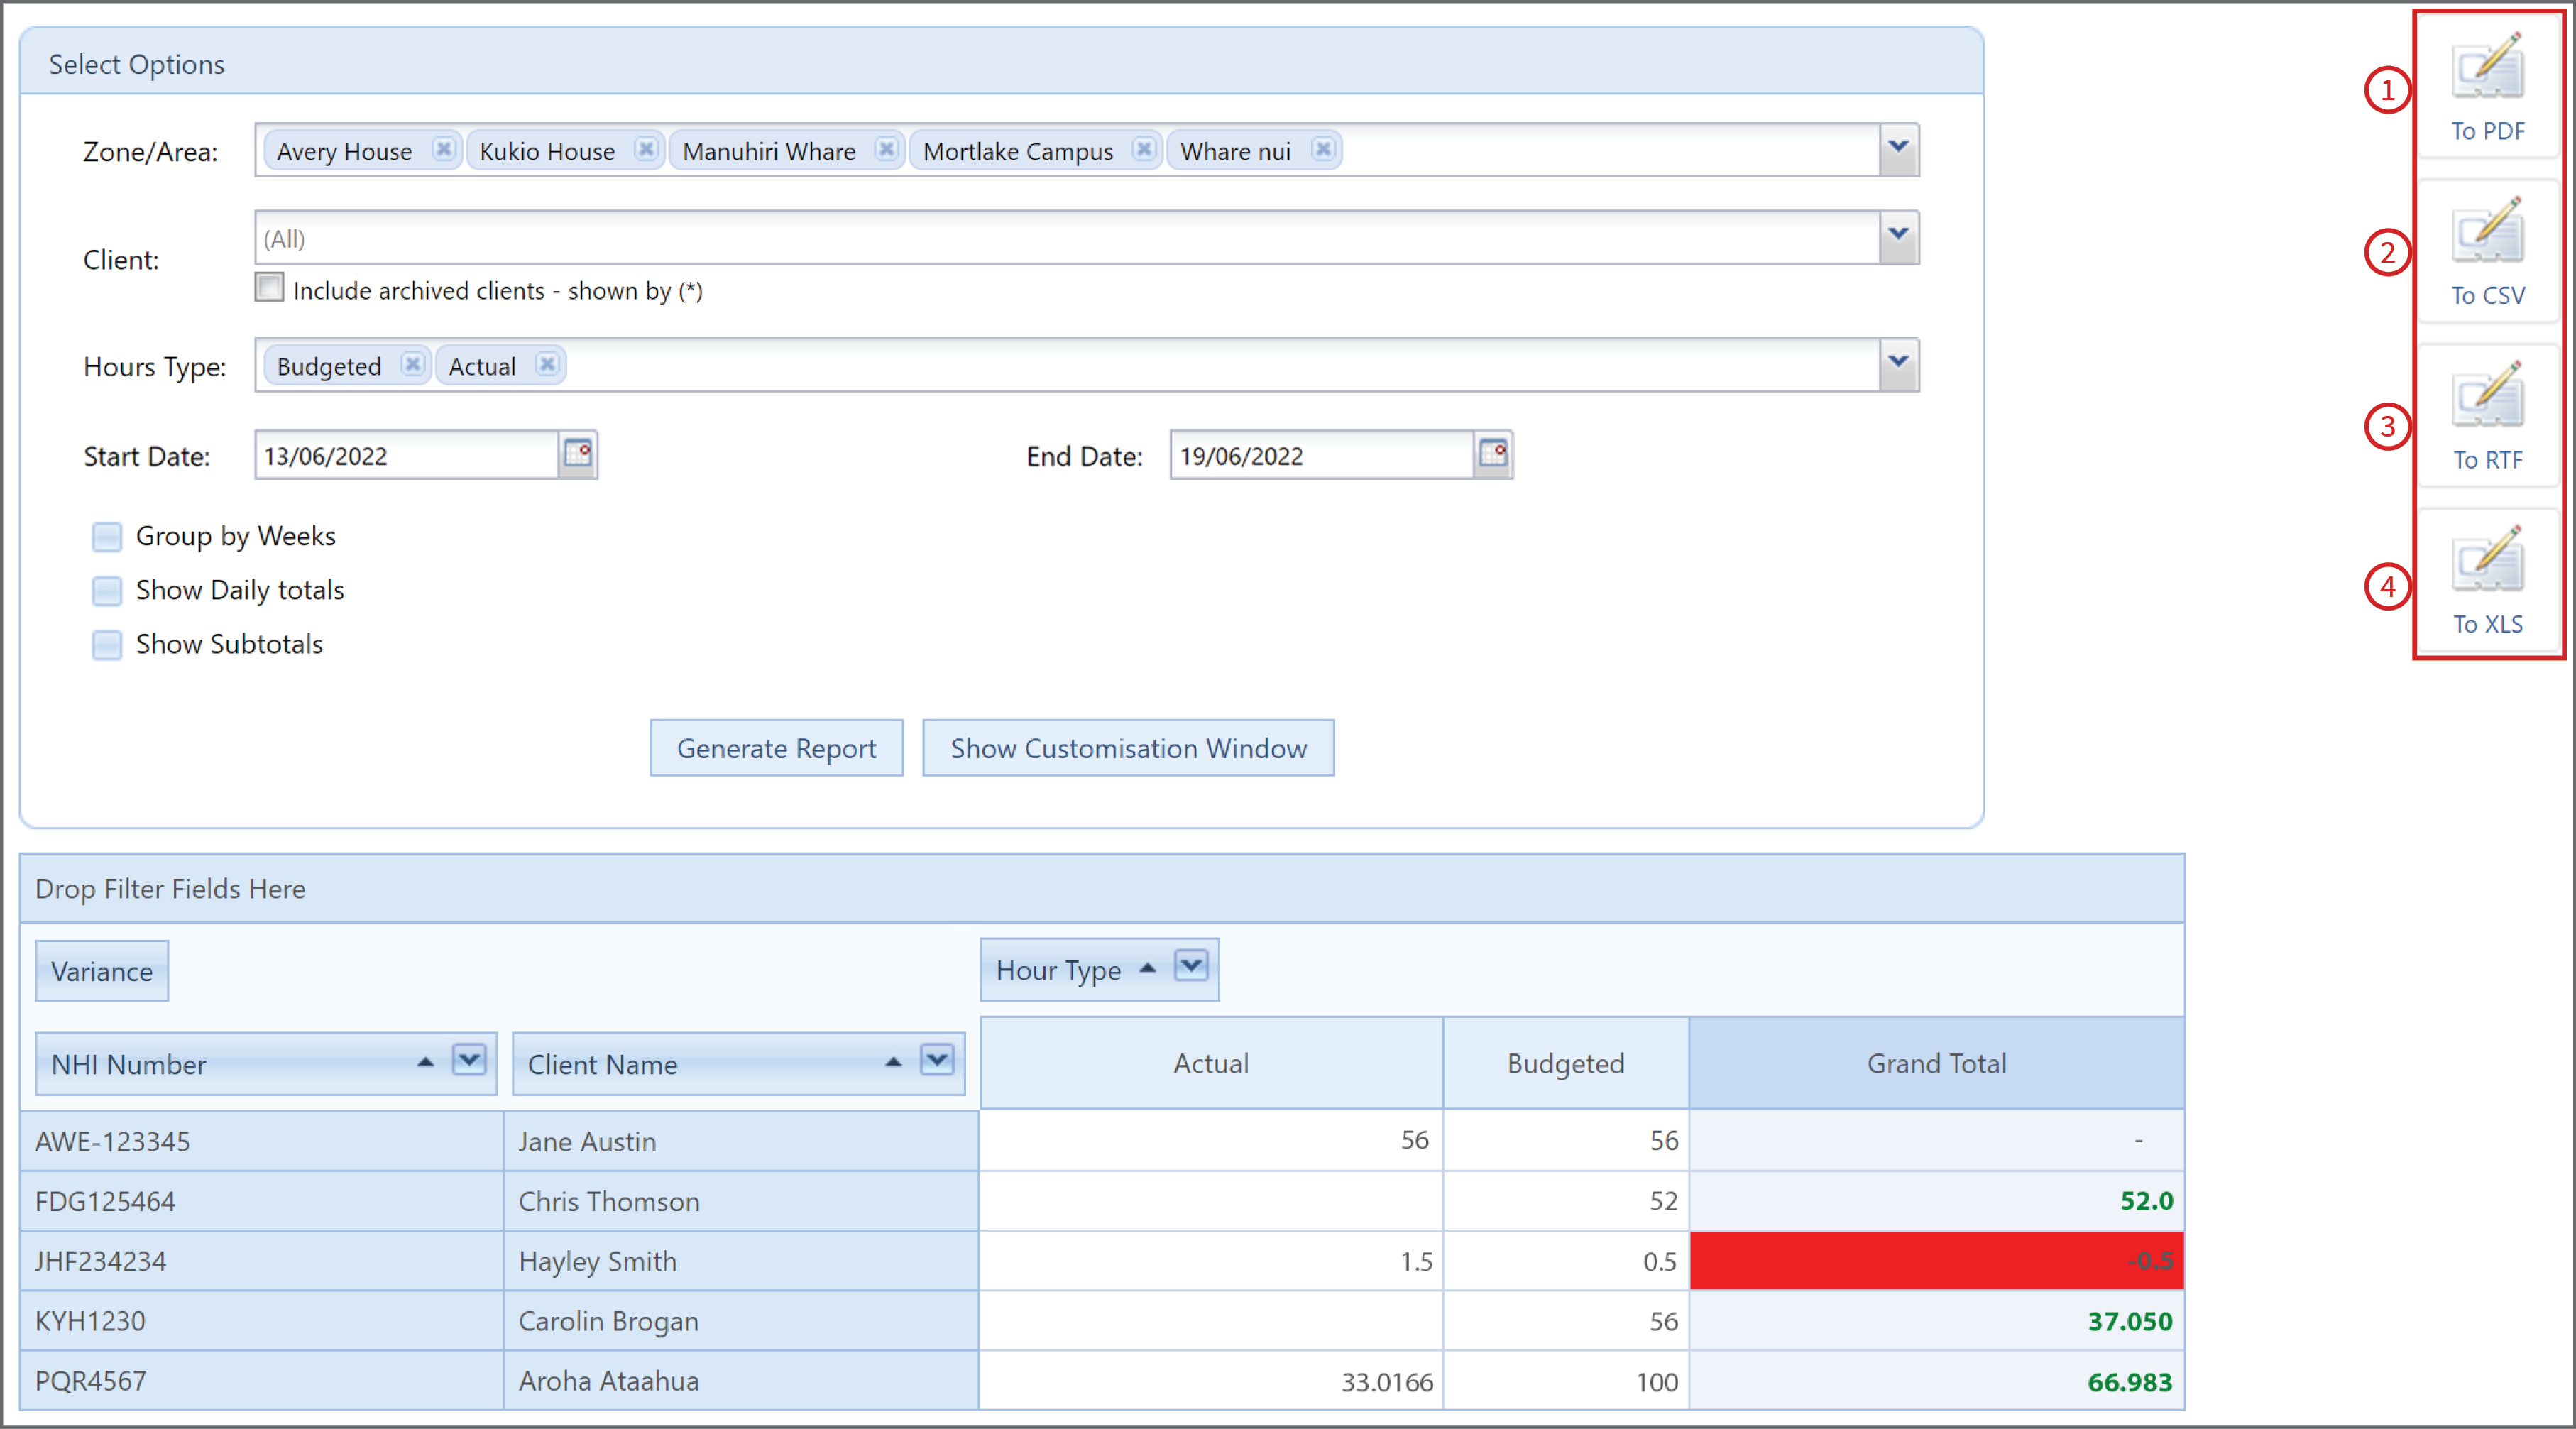
Once you are happy with the data generated, you can export it to PDF (1), CSV (2), RTF (3) or XLS (4) file depending on your needs.